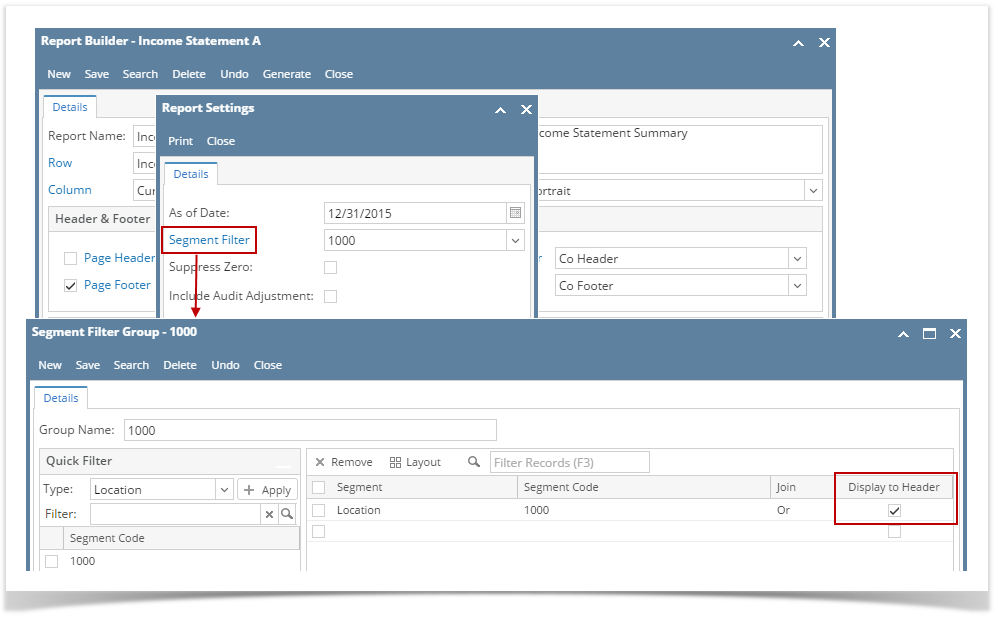
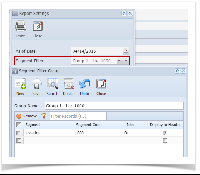
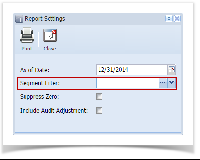
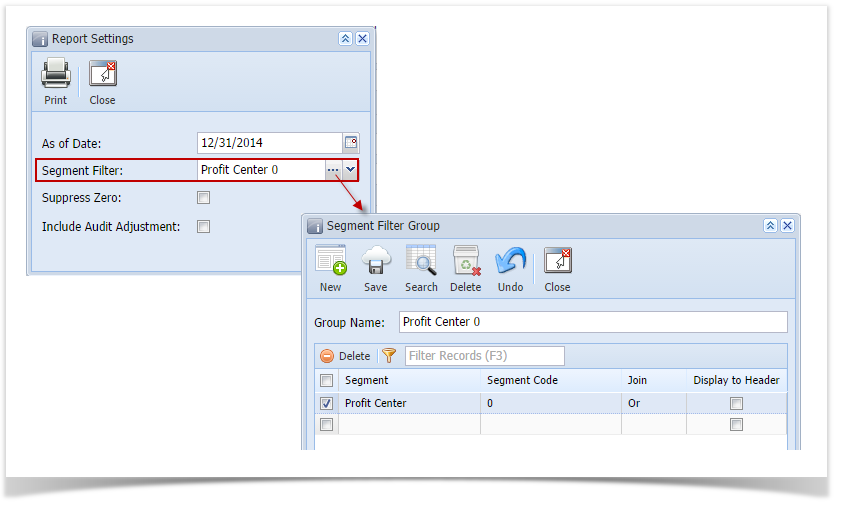
- In the Report Settings screen, select a Segment Filter. Then click the Segment Filter label to open the Segment Filter Group screen.
- If you want the Segment Filter be shown on the report when previewed or printed, check the Display to Header checkbox, else leave it unchecked.
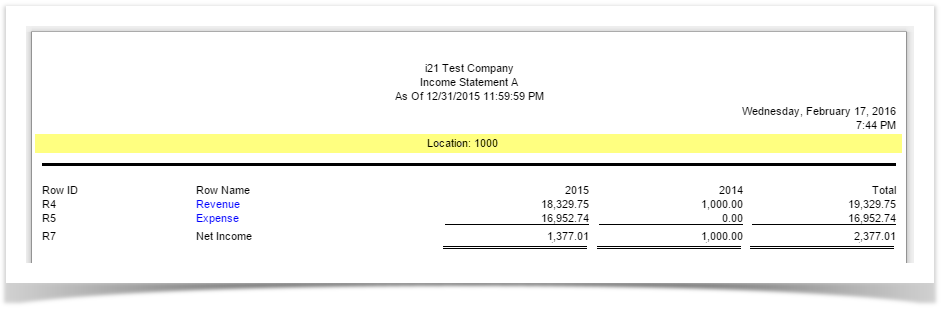
Here's how it is shown when report is previewed/printed. Highlighted section is the Segment Filter Group type header/footer.
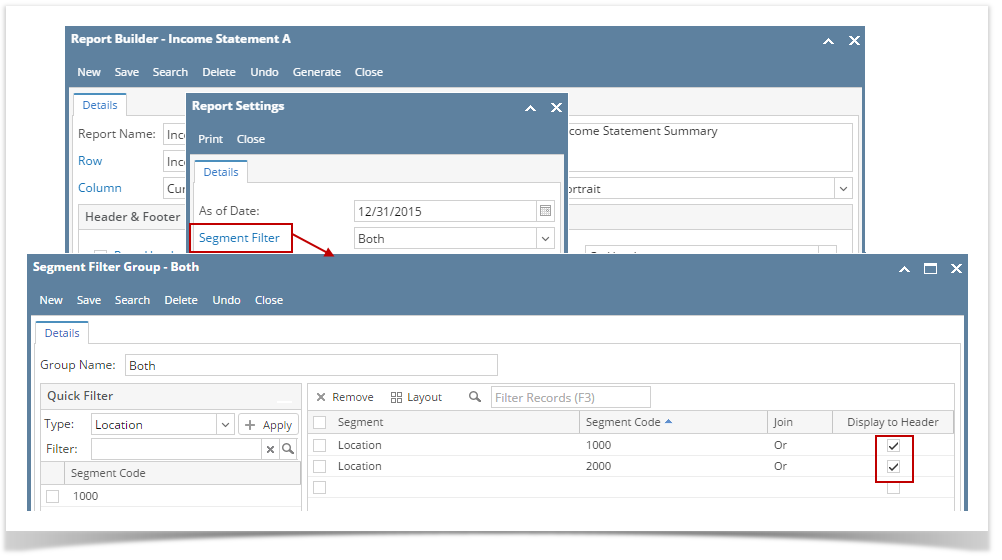
If multiple segments are checked, then all these segments are shown on the report.
You can enhance this header/footer by setting its Font Properties and Row Height. See How to Configure header and footer font properties and row height topic to guide you on how to do this.
Say this is the column designer configuration.
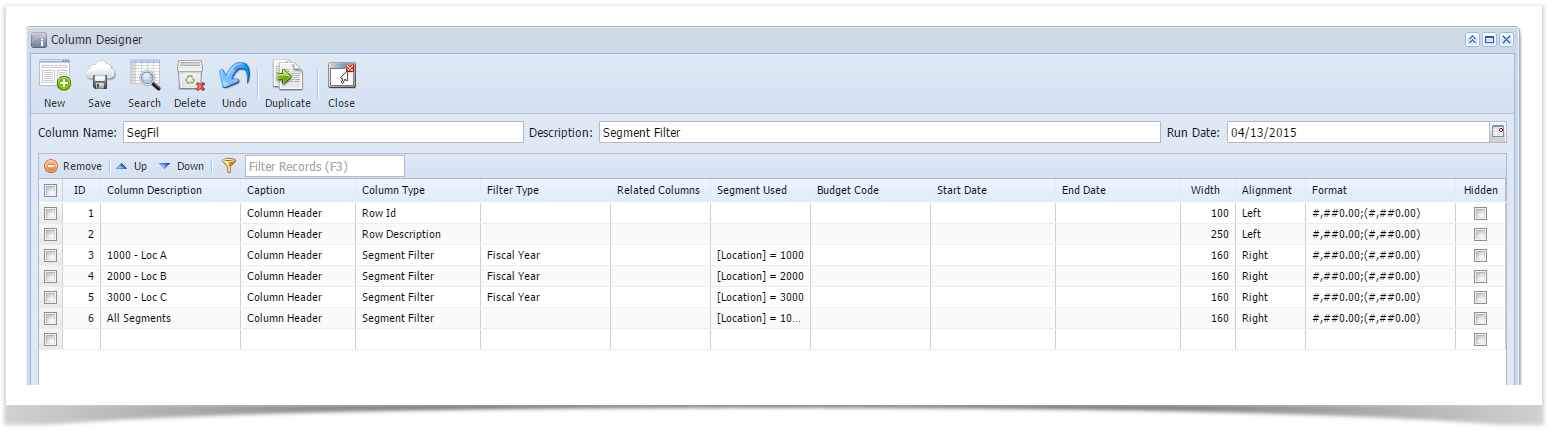
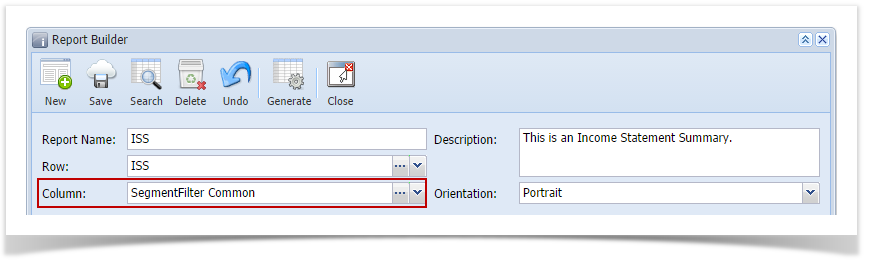
And this column designer is used as component of one of your financial reports.
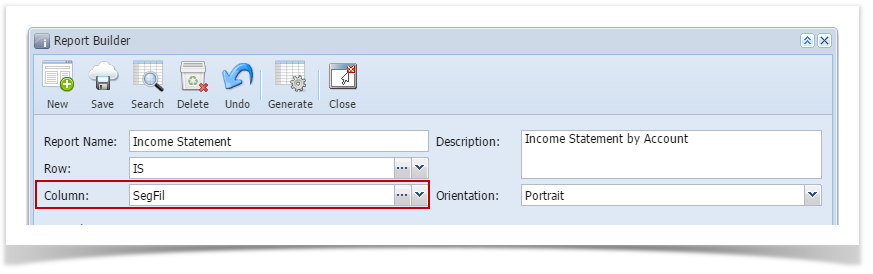
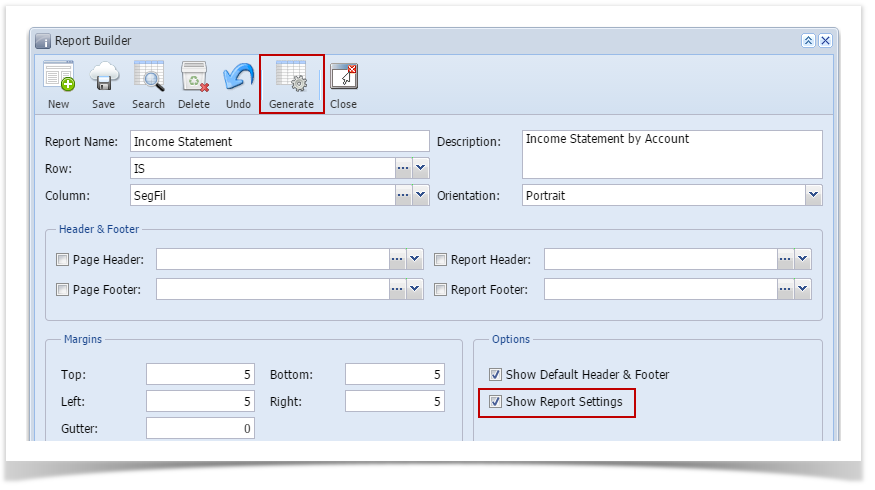
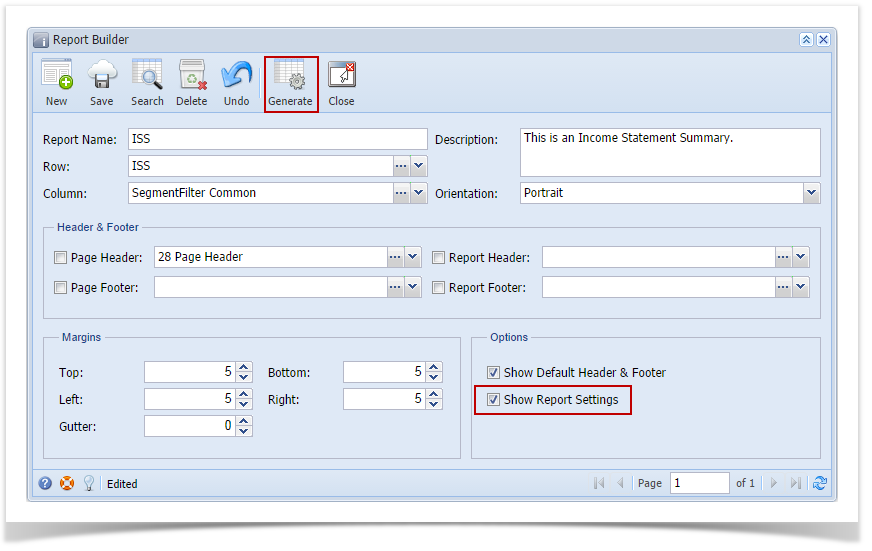
- When printing report, make sure that Show Report Settings checkbox is checked. Click Generate toolbar button.
- The Report Setting screen opens. In the Segment Filter field select the segment you want all your columns with Segment Filter column type be filtered. Take note that this overrides what had been setup in the Column type segment filter.
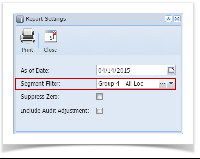
If you have not yet configured a segment filter, click the ellipsis button to open the Segment Filter Group screen to add or edit a segment filter. See How to Configure Segment Filter Group screen. - If you want to print the report but would like to filter only those transpired for a specific segment like shown in the screenshot below, then you can create and configure the Segment Filter Group screen to reflect that segment group only and select that in the Segment Filter field when printing the report.
See in the below report, only the totals for selected segment filter is shown in the report, other segments are showing 0.00.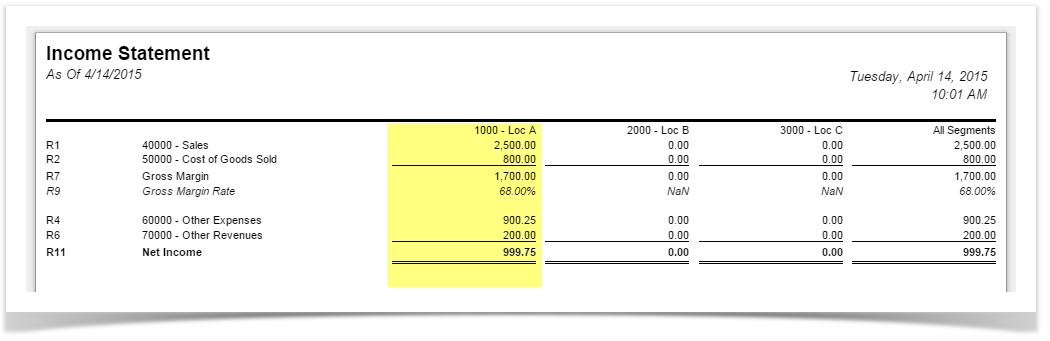
You can even create different Segment groups with its corresponding segment filter configuration so that you will just have to select it when printing reports. Below is an example of filters for difference segment groups.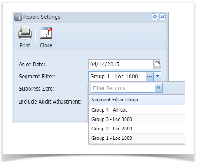
And here is a sample of multiple segments configured for a segment filter group.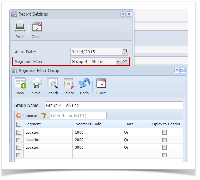
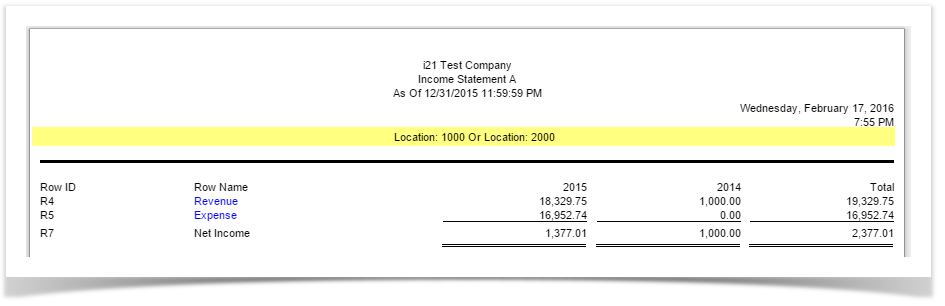
See in the below report, totals for selected segment filters are shown in the report.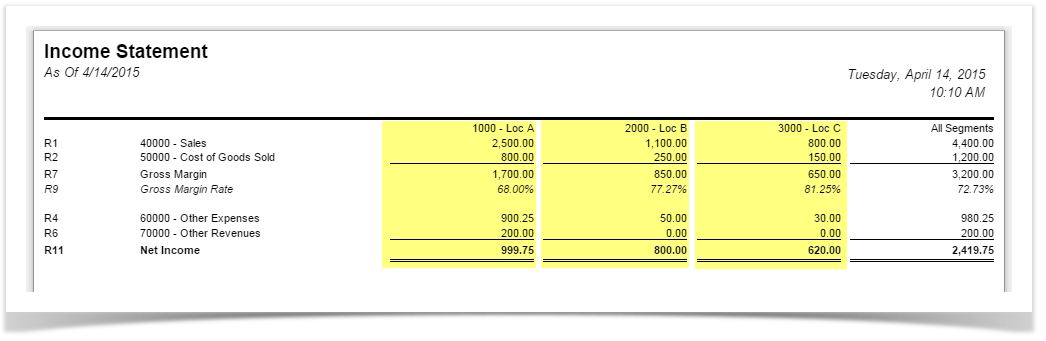
Say this is the column designer configuration. Segment Filter column here does not have Column Segment Filter configuration, as the Segment Used field shows blank.
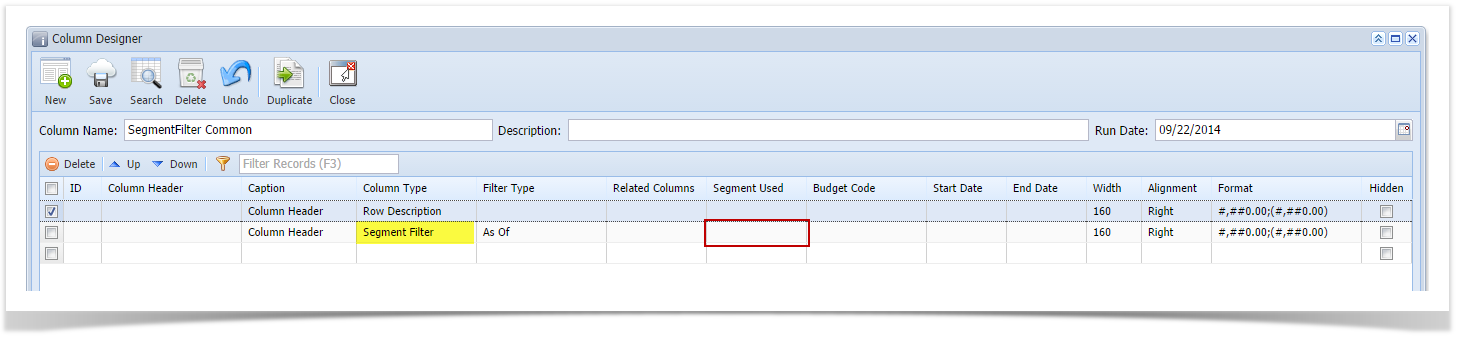
And this column designer is used as component of one of your financial reports.
- When printing report, make sure that Show Report Settings checkbox is checked. Click Generate toolbar button.
- The Report Setting screen opens. In the Segment Filter field select the segment you want all your columns with Segment Filter column type be filtered. Take note that this overrides what had been setup in the Column type segment filter.
If you have not yet configured a segment filter, click the ellipsis button to open the Segment Filter Group screen to add and configure a filter. See How to Add Segment Filter from Column Designer. - If you want to print the report but would like to filter only those transpired for a specific segment like shown in the screenshot below, then you can create and configure the Segment Filter Group screen to reflect that segment group and select that in the Segment Filter field when printing the report.
You can even create different Segment groups with its corresponding segment filter configuration so that you will just have to select it when printing reports. Now the Column Designer record with Segment Fitler column type setup becomes just a template and it is the Segment Filter field in the Report Settings screen who controls what information to show based on the selected segment filter. - Here's how it is shown when report is previewed/printed.
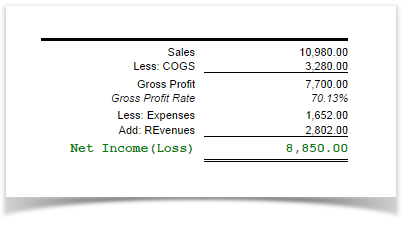
The totals above reflect only of the Profit Center > 0 - General.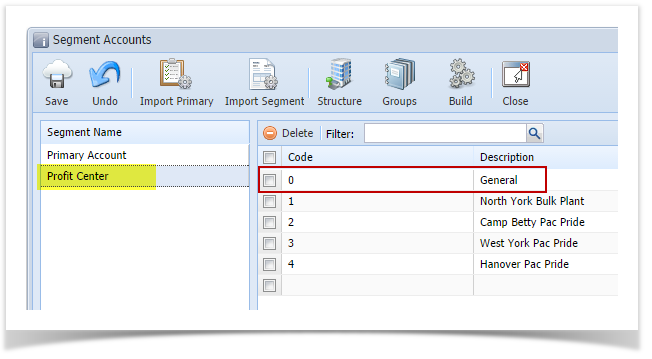
Overview
Content Tools