Page History
A Pivot Grid Style panel is like a data summarization that can automatically sort, count, give the total or the average of the data stored in table/s. It also has a capability to display results in a second table (called a Pivot Table ) showing the summarized data. The user can set up and change the summary's structure by dragging and dropping of column/fields graphically if its Area setting is Data.
Below is a sample screenshot of Panel Settings for a Pivot Grid Style panel:
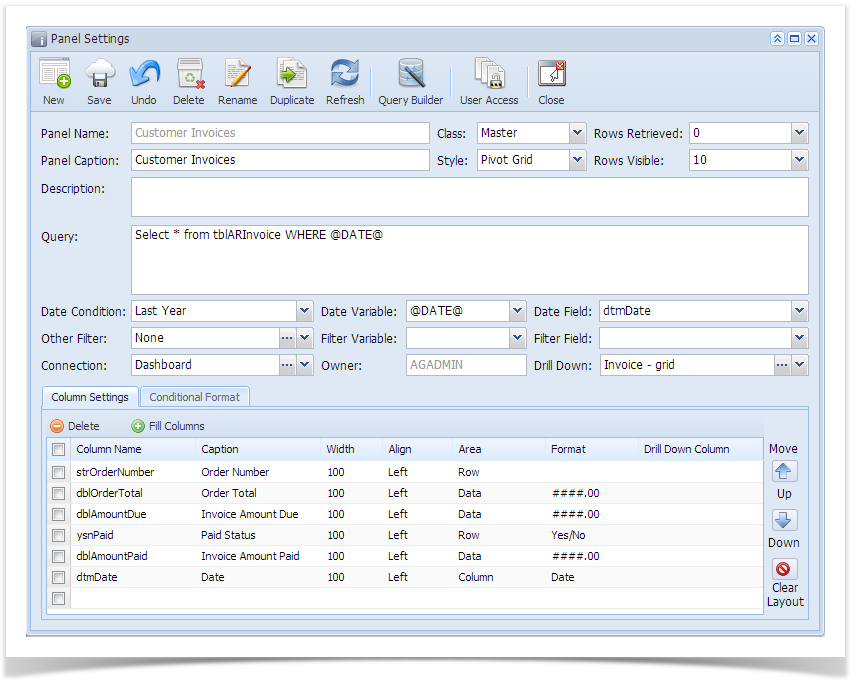
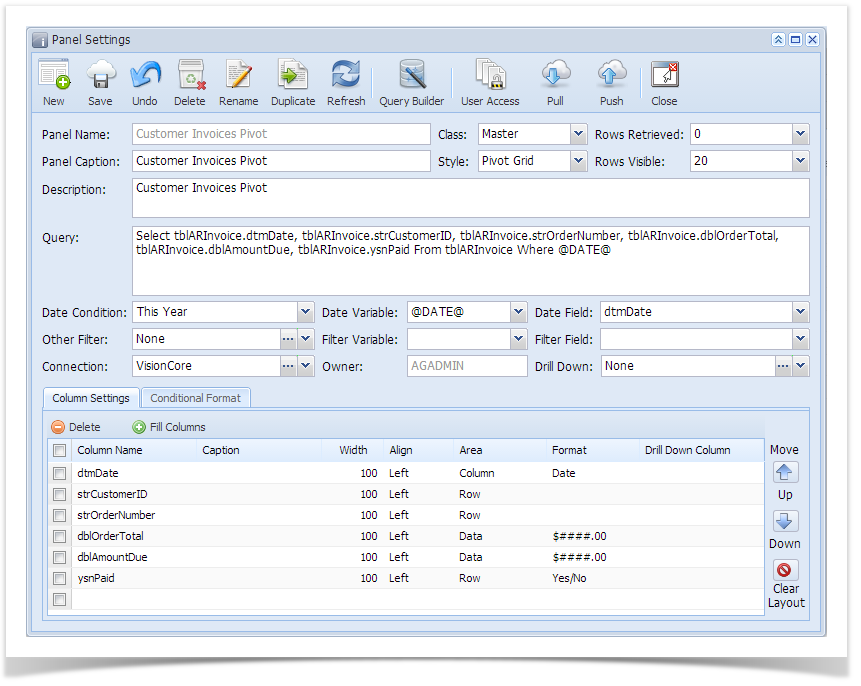
Defaults:
When selecting a column or field in the Column Settings tab, the default value for Width is 100, Align is Left, and Area is Filter
...
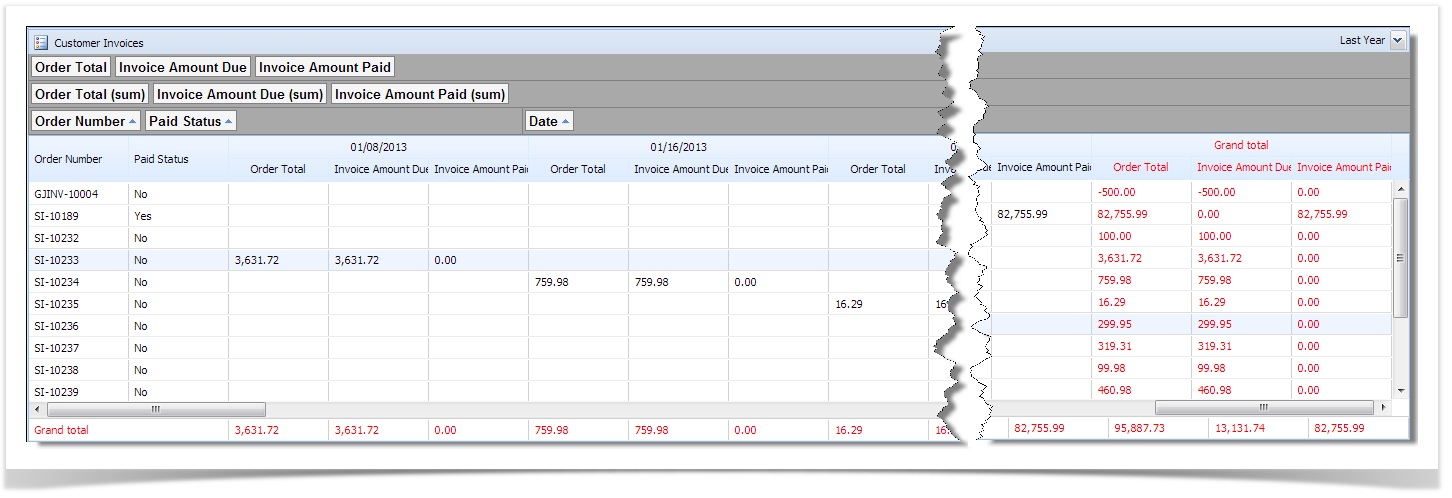
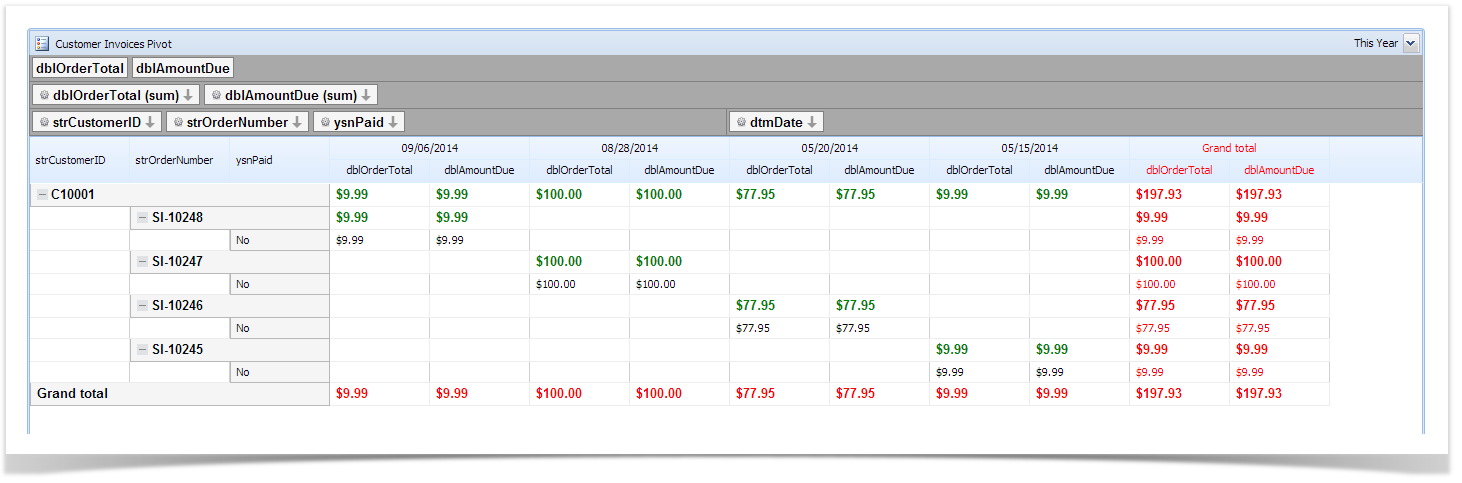
Below is a sample result once you place the panel on the Dashboard.
Overview
Content Tools