Page History
A Line Chart is a style of chart that is created by connecting a series of data points together with a line. While Spline Charts are specialized forms of conventional line and area charts. Unlike conventional charts which connect data points with straight lines, a Spline chart draws a fitted curve through the data points.
Configuration Option:
| Name | Type | Default | Description | |
|---|---|---|---|---|
| Legend | boolean | false | Title of the axis | |
| Height | number | 250 | The height of the chart in pixels | |
| Color | boolean/number | base | Graph coloring | |
| Label Position | number | 0 | Labeling graphs | |
| Axis X: Column Name | string | The Column Name of where we get the data. | ||
| Axis X: Title/Legend | string | Title to be set on the chart | ||
| Axis X: Display Title | boolean | false | ||
| Axis X: Format | string | number | ||
| Axis Y: Column Name | string | The Column Name of where we get the data. | ||
| Axis Y: Title/Legend | string | Title to be set on the chart | ||
| Axis Y: Display Title | boolean | false | ||
| Axis Y: Format | string | number |
Sample Panel Settings:
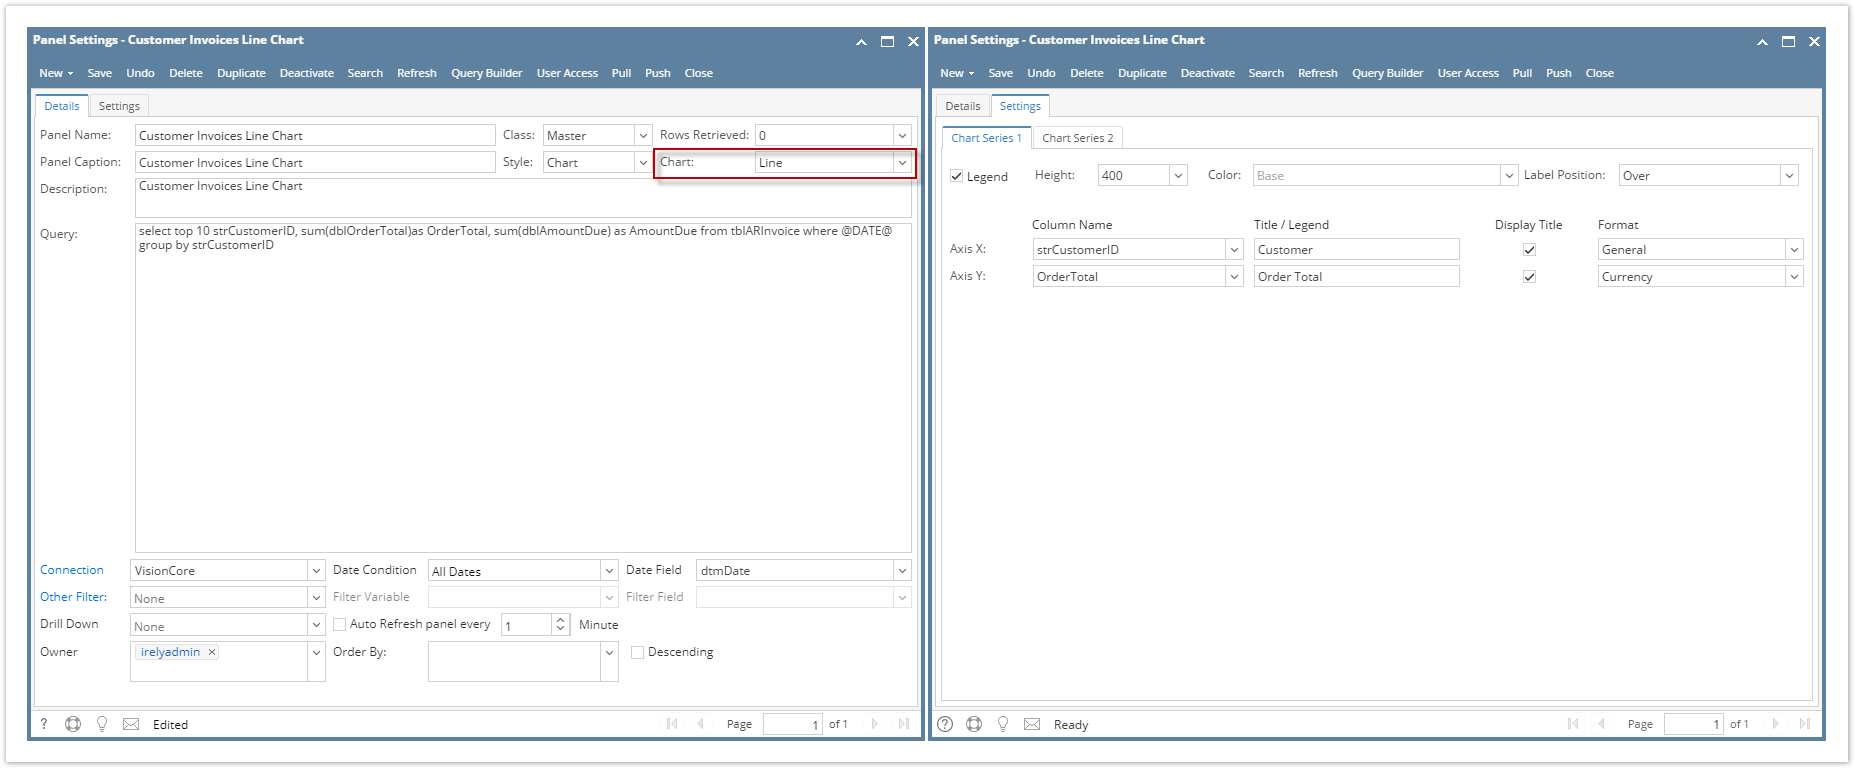
- Line Chart:
- Sample Result:

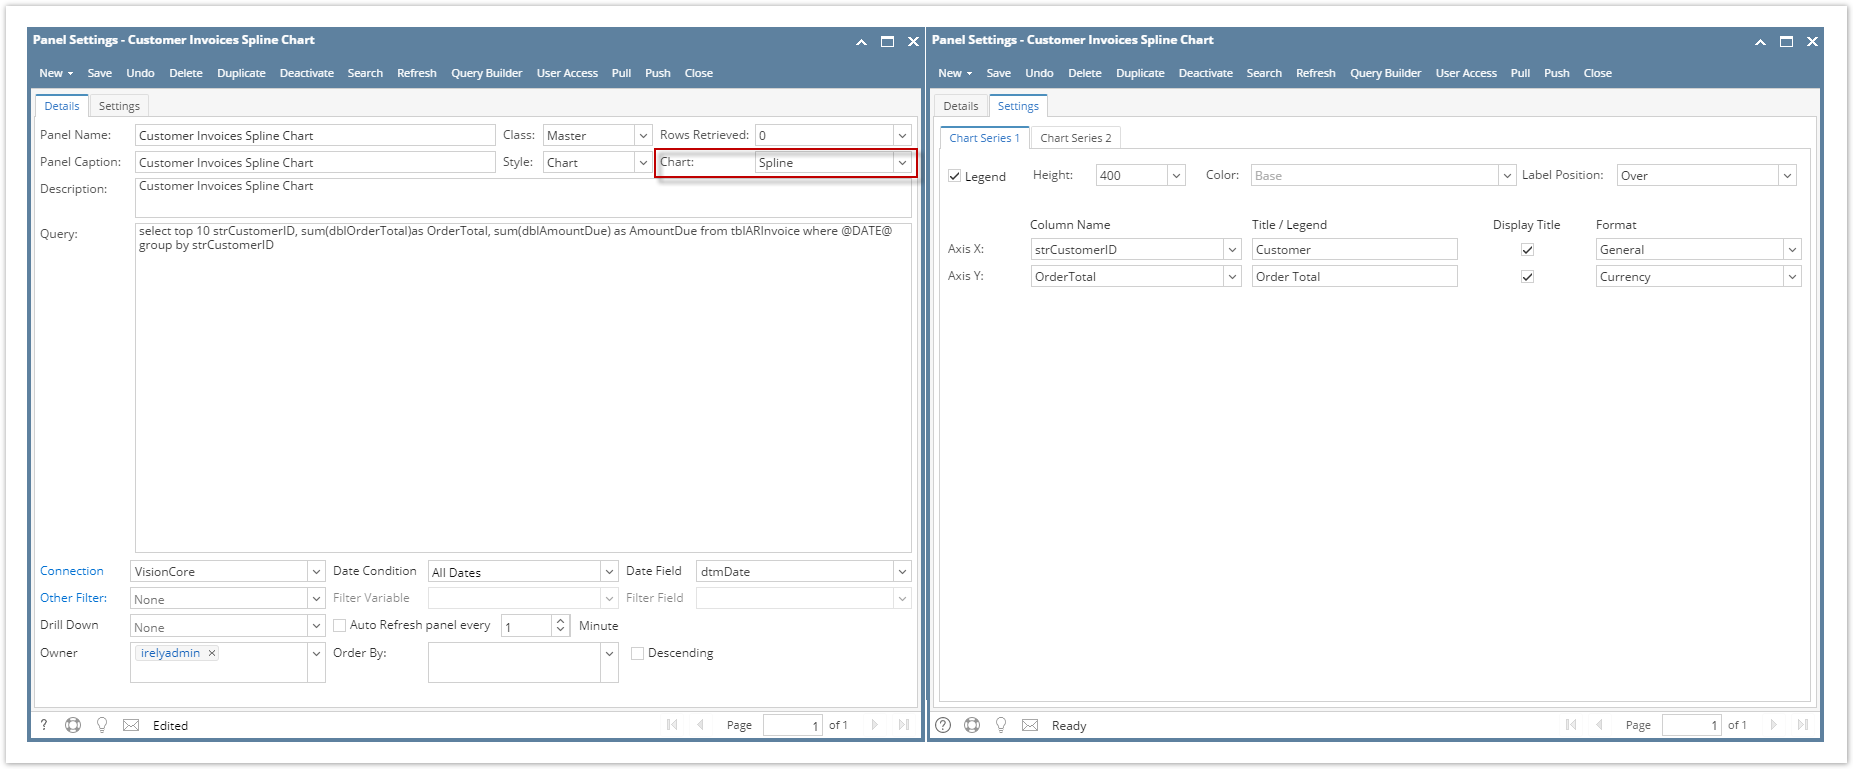
- Spline Chart:
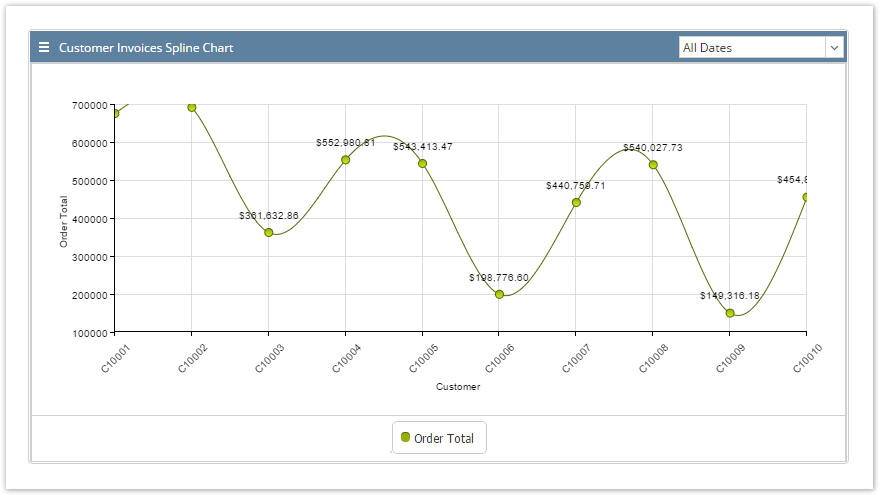
- Sample Result:
...
| title | 15.3 |
|---|
A Line Chart is a style of chart that is created by connecting a series of data points together with a line. While Spline Charts are specialized forms of conventional line and area charts. Unlike conventional charts which connect data points with straight lines, a Spline chart draws a fitted curve through the data points.
Configuration Option:
| Name | Type | Default | Description |
|---|---|---|---|
| Legend | boolean | false | Title of the axis |
| Height | number | 250 | The height of the chart in pixels |
| Color | boolean/number | base | Graph coloring |
| Label Position | number | 0 | Labeling graphs |
| Axis X: Column Name | string | The Column Name of where we get the data. | |
| Axis X: Title/Legend | string | Title to be set on the chart | |
| Axis X: Display Title | boolean | false | |
| Axis X: Format | string | number | |
| Axis Y: Column Name | string | The Column Name of where we get the data. | |
| Axis Y: Title/Legend | string | Title to be set on the chart | |
| Axis Y: Display Title | boolean | false | |
| Axis Y: Format | string | number |
Sample Panel Settings:
- Line Chart:

- Sample Result:

...
Overview
Content Tools