Page History
A Pie Chart (or a circle chart) is a circular statistical graphic, which is divided into slices to illustrate numerical proportion.
Configuration Option:
| Name | Type | Default | Description |
|---|---|---|---|
| Legend | boolean | false | Title of the axis |
| Height | number | 250 | The height of the chart in pixels |
| Color | boolean/number | base | Graph coloring |
| Label Position | number | 0 | Labeling graphs |
| Value: Column Name | string |
| The Column Name of where we get the data. | |
| Value: Title/Legend | string |
| Title to be set on the chart | ||
| Value: Display Title | boolean | false |
| Value: Format | string | number |
| Argument: Column Name | string |
| Argument: Title/Legend | string |
| Argument: Display Title | boolean | false |
| Argument: Format | string | number |
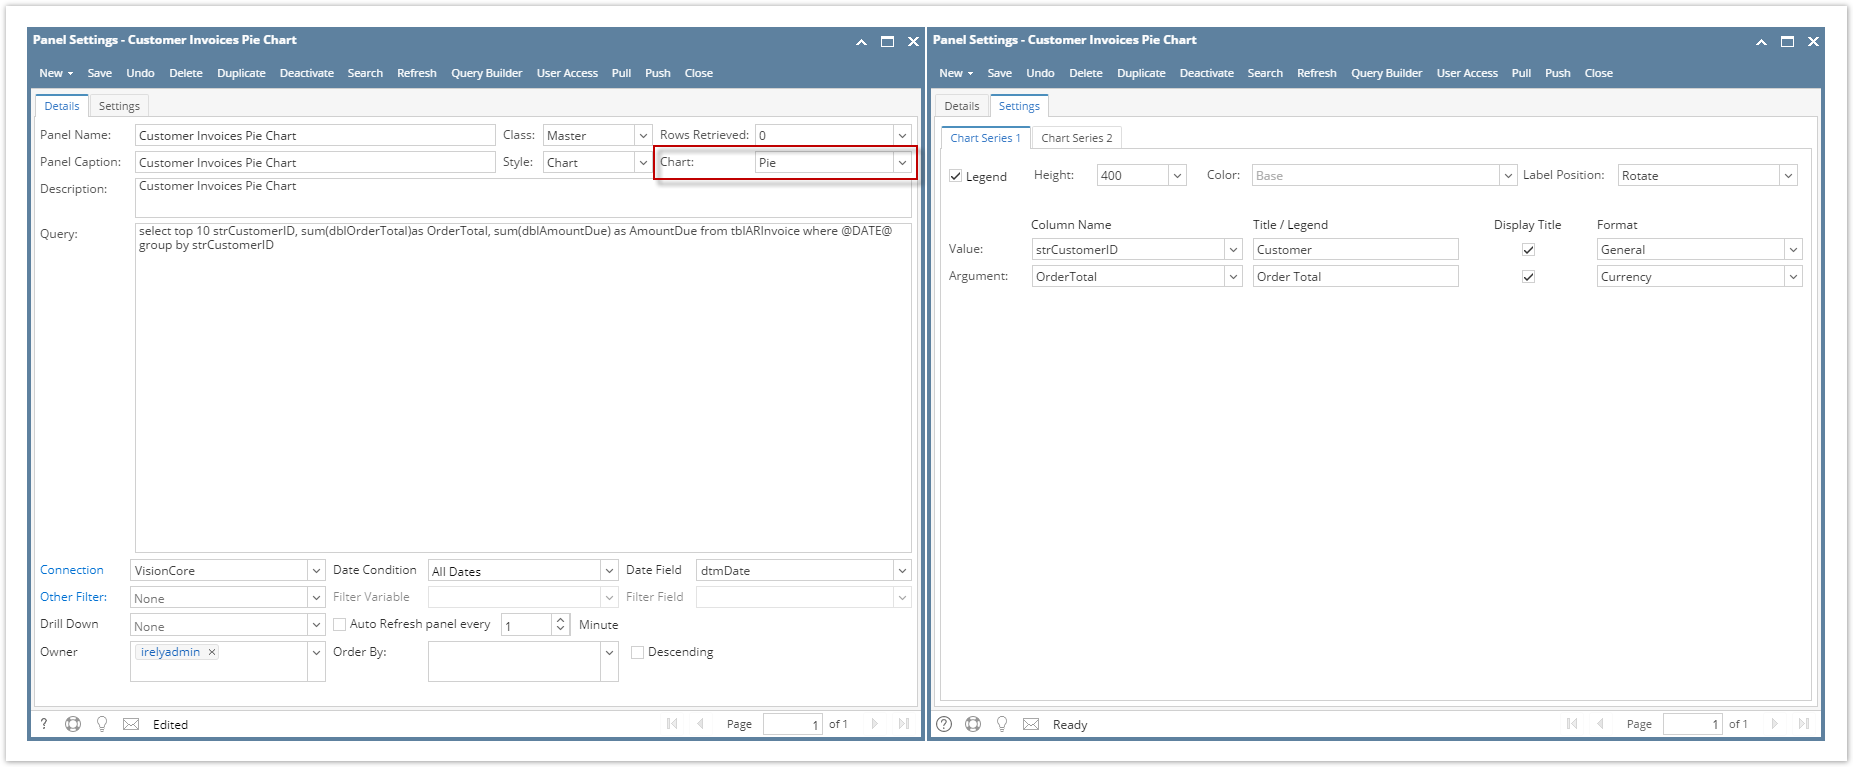
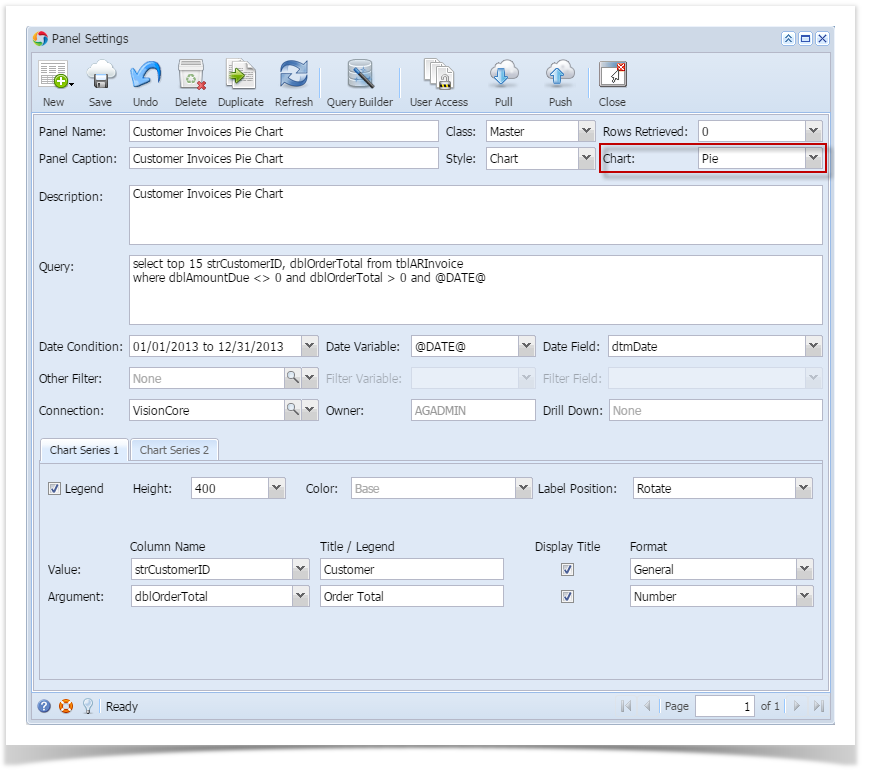
Sample Panel Settings:
- Pie Chart:
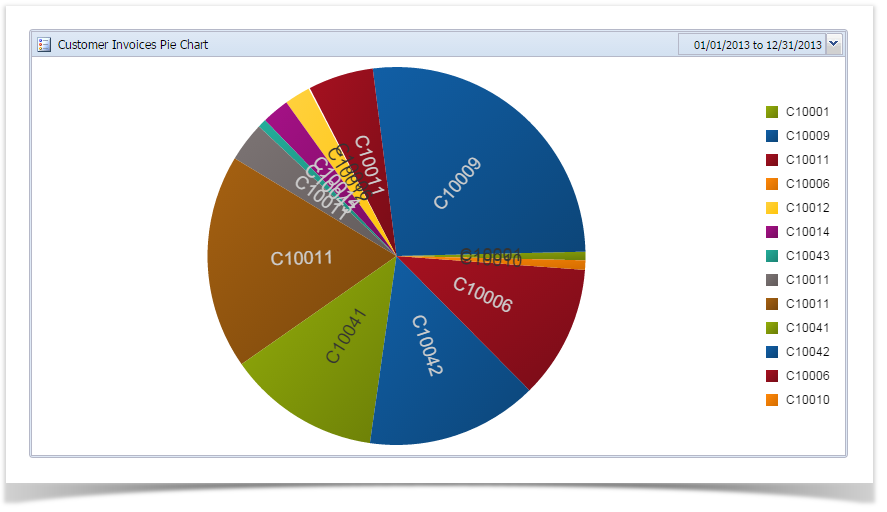
- Sample Result:
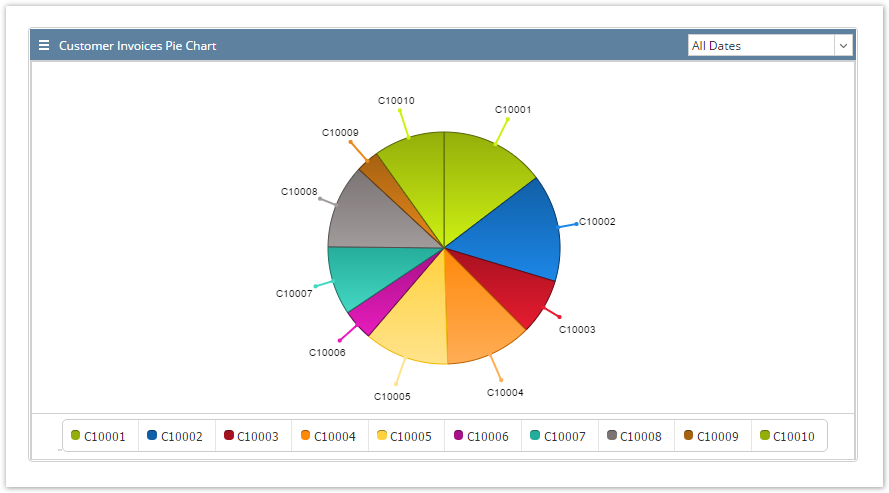
...
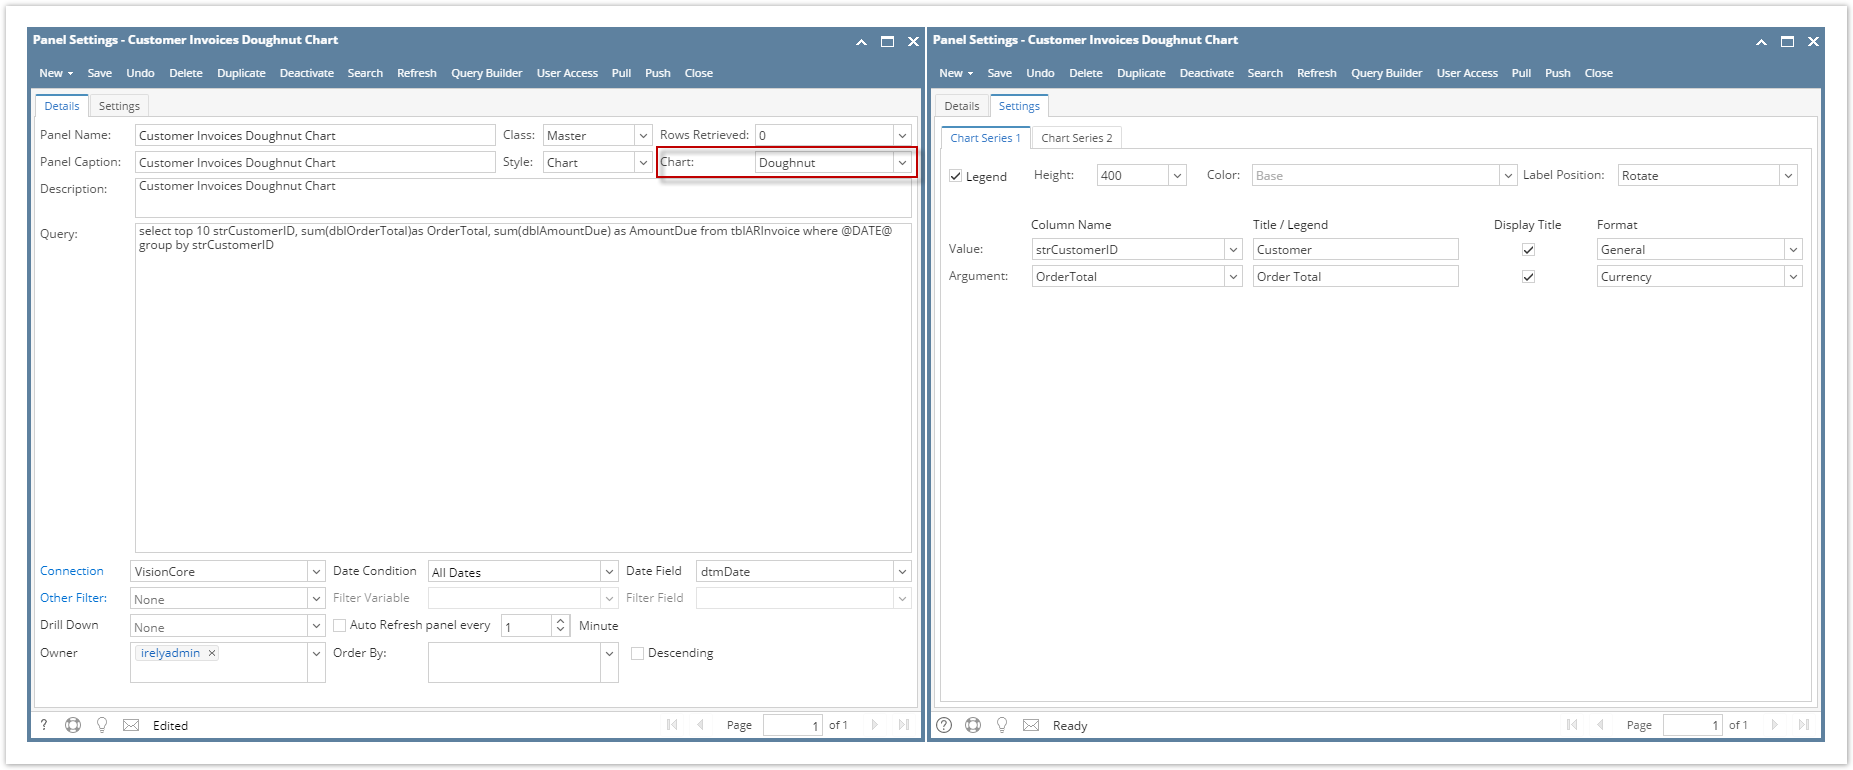
- Doughnut Chart:
- Sample Result:
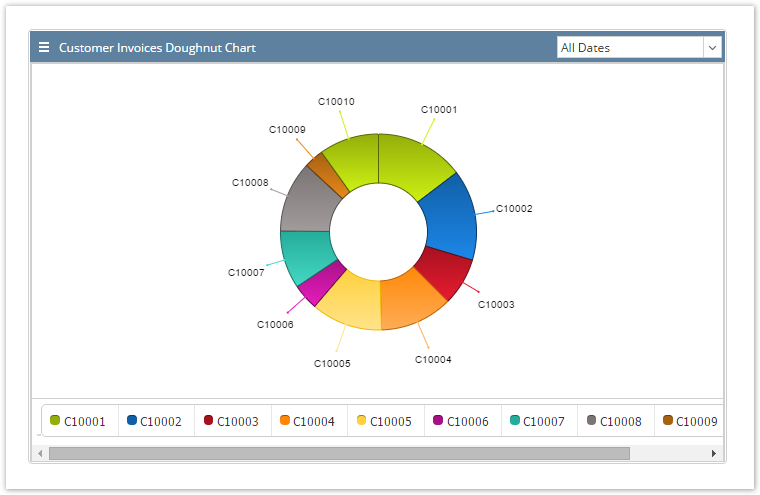
...
| title | 15.3 |
|---|
A Pie Chart (or a circle chart) is a circular statistical graphic, which is divided into slices to illustrate numerical proportion.
Configuration Option:
| Name | Type | Default | Description |
|---|---|---|---|
| Legend | boolean | false | Title of the axis |
| Height | number | 250 | The height of the chart in pixels |
| Color | boolean/number | base | Graph coloring |
| Label Position | number | 0 | Labeling graphs |
| Value: Column Name | string | The Column Name of where we get the data. | |
| Value: Title/Legend | string | Title to be set on the chart | |
| Value: Display Title | boolean | false | |
| Value: Format | string | number | |
| Argument: Column Name | string | ||
| Argument: Title/Legend | string | ||
| Argument: Display Title | boolean | false | |
| Argument: Format | string | number |
Sample Panel Settings:
- Pie Chart:
- Sample Result:
...
Overview
Content Tools