A Pivot Grid Style panel is like a data summarization that can automatically sort, count, give the total or the average of the data stored in table/s. It also has a capability to display results in a second table (called a Pivot Table ) showing the summarized data. The user can set up and change the summary's structure by dragging and dropping of column/fields graphically if its Area setting is Data.
Below is a sample screenshot of Panel Settings for a Pivot Grid Style panel:
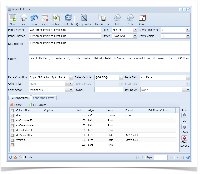
Defaults:
When selecting a column or field in the Column Settings tab, the default value for Width is 100, Align is Left, and Area is Filter
Column Settings:
The Area column has 3 available types such as Row, Column, and Data. In this sample, the column is Invoice Date, the rows are Invoice Number and Paid Status, and the data we would like to see are (sum of) Invoice Total , Invoice Amount Due and Invoice Amount Paid.
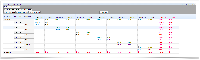
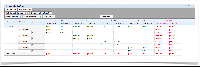
Below is a sample result once you place the panel on the Dashboard.
A Pivot Grid Style panel is like a data summarization that can automatically sort, count, give the total or the average of the data stored in table/s. It also has a capability to display results in a second table (called a Pivot Table ) showing the summarized data. The user can set up and change the summary's structure by dragging and dropping of column/fields graphically if its Area setting is Data.
Below is a sample screenshot of Panel Settings for a Pivot Grid Style panel:
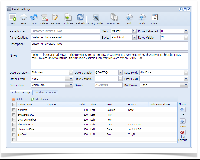
Defaults:
When selecting a column or field in the Column Settings tab, the default value for Width is 100, Align is Left, and Area is Filter
Column Settings:
The Area column has 3 available types such as Row, Column, and Data. In this sample, the column is Invoice Date, the rows are Invoice Number and Paid Status, and the data we would like to see are (sum of) Invoice Total , Invoice Amount Due and Invoice Amount Paid.
Below is a sample result once you place the panel on the Dashboard.
Overview
Content Tools