Page History
A Bar Chart is a chart that uses either horizontal or vertical bars to show comparisons among categories. One axis of the chart shows the specific categories being compared, and the other axis represents a discrete value.
Configuration Option:
| Name | Type | Default | Description |
|---|---|---|---|
| Legend | boolean | false | Title of the axis |
| Height | number | 250 | The height of the chart in pixels |
| Color | boolean/number | base | Graph coloring |
| Label Position | number | 0 | Labeling graphs |
| Axis X: Column Name | string |
| The Column Name of where we get the data. | ||
| Axis X: Title/Legend | string |
| Title to be set on the chart | ||
| Axis X: Display Title | boolean | false |
| Axis X: Format | string | number |
| Axis Y: Column Name | string |
| The Column Name of where we get the data. | |
| Axis Y: Title/Legend | string |
| Title to be set on the chart | ||
| Axis Y: Display Title | boolean | false |
| Axis Y: Format | string | number |
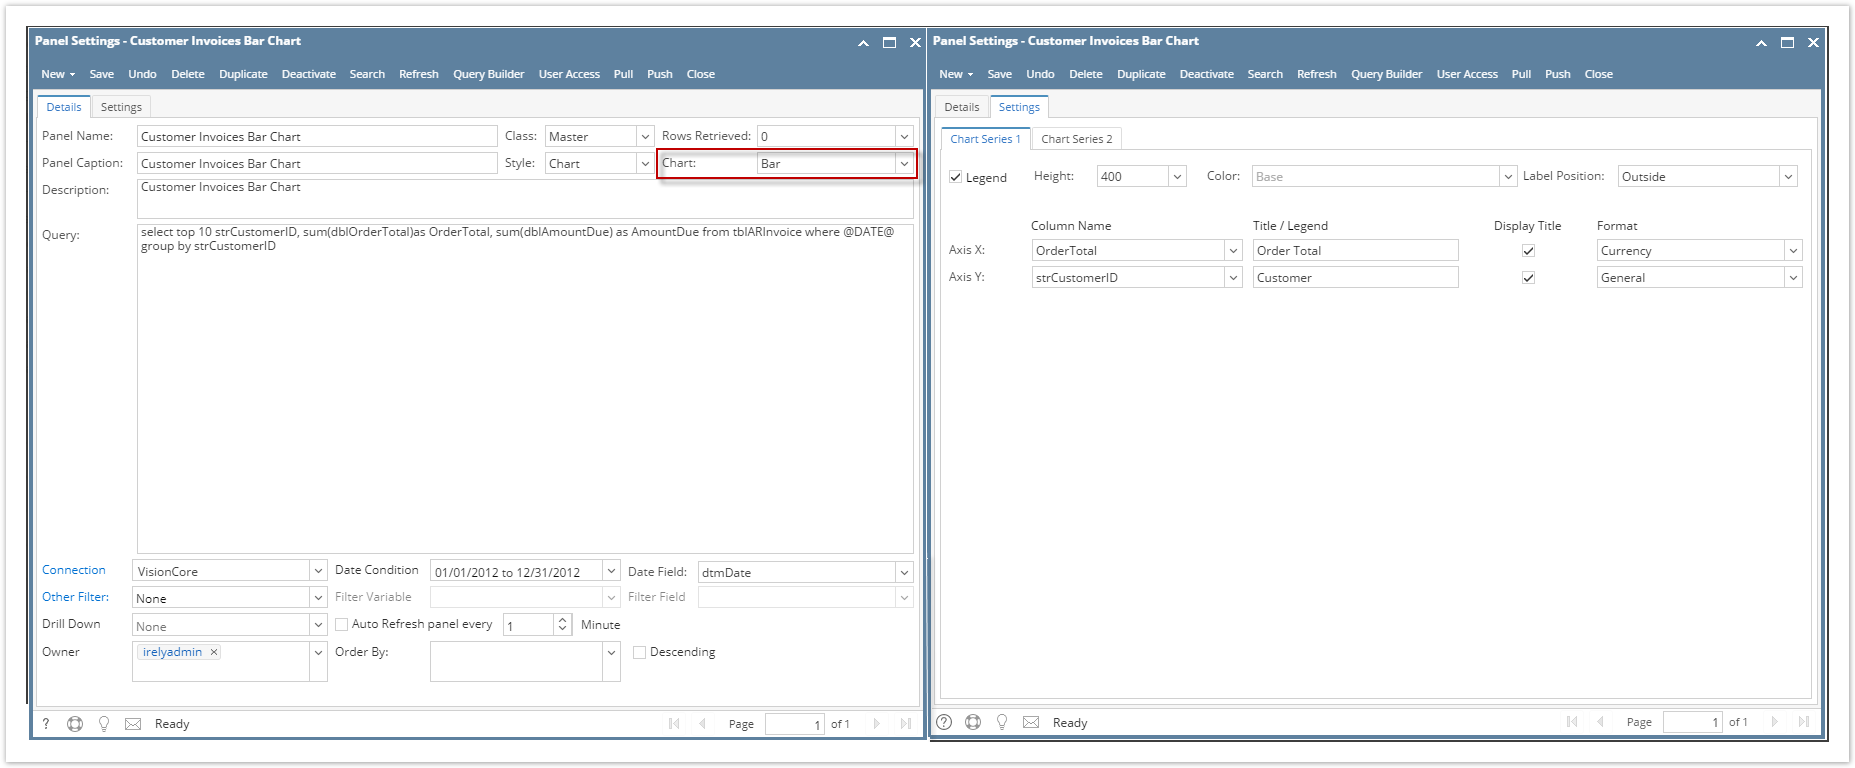
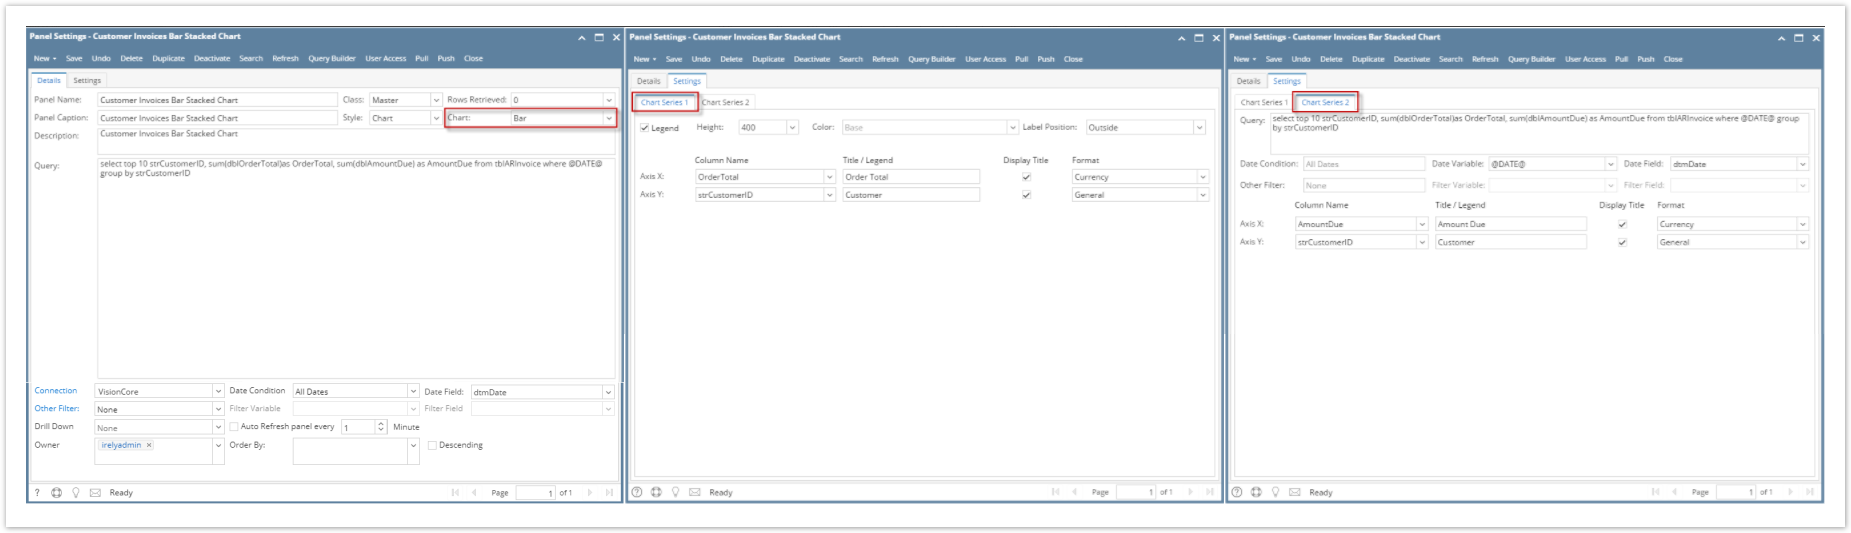
Sample Panel Settings:
- Bar Chart:

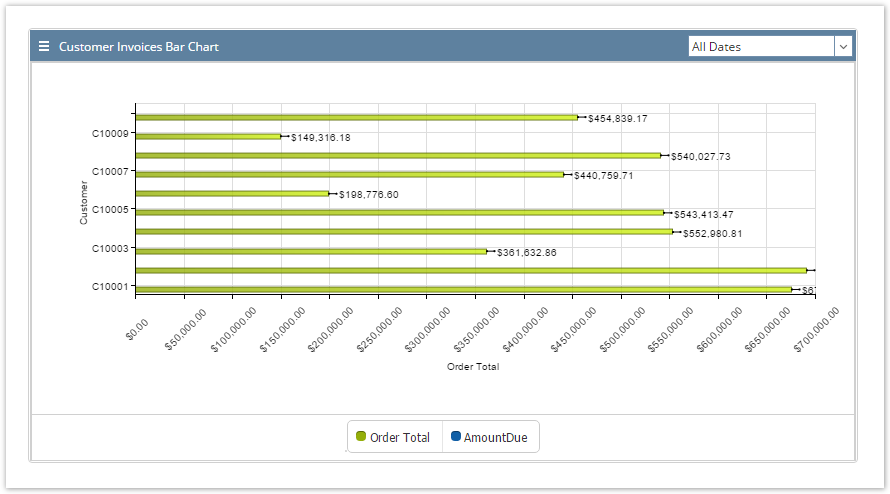
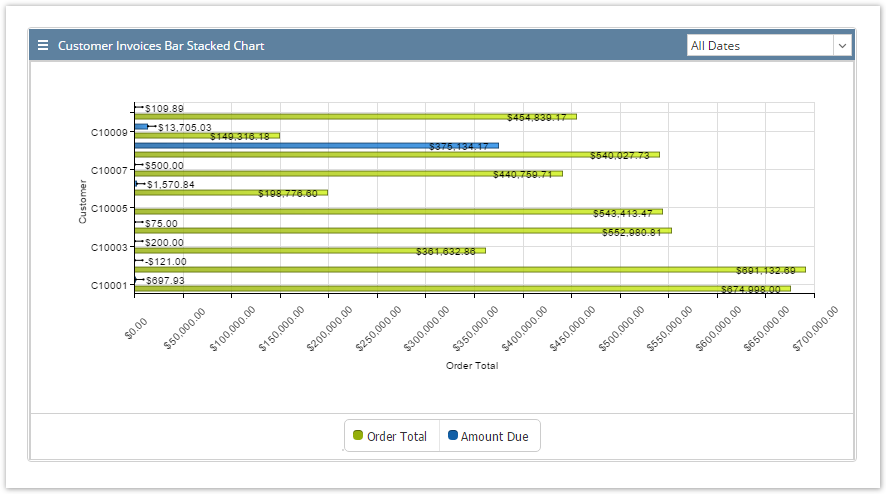
- Sample Result:

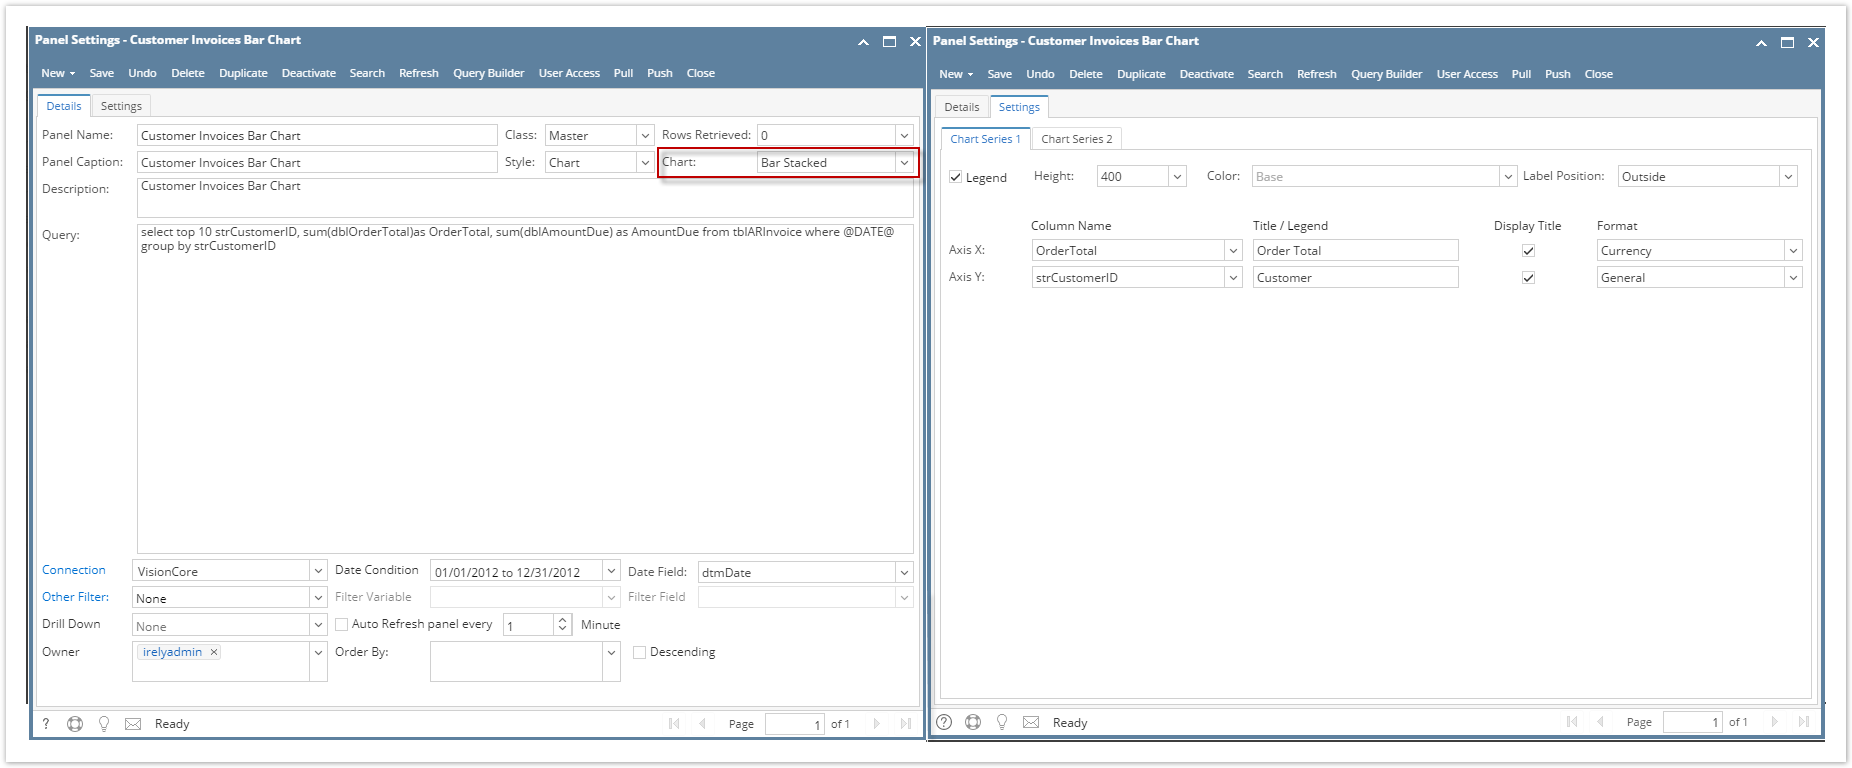
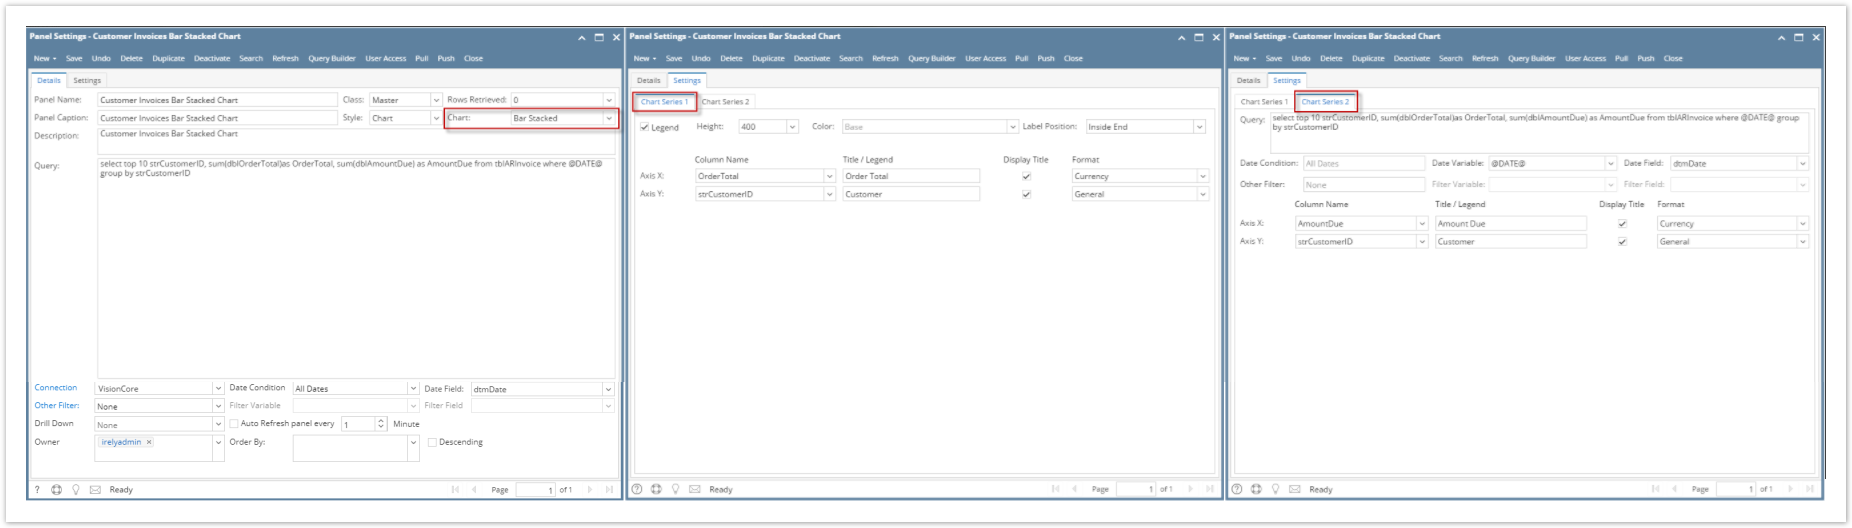
- Bar Stacked Chart:

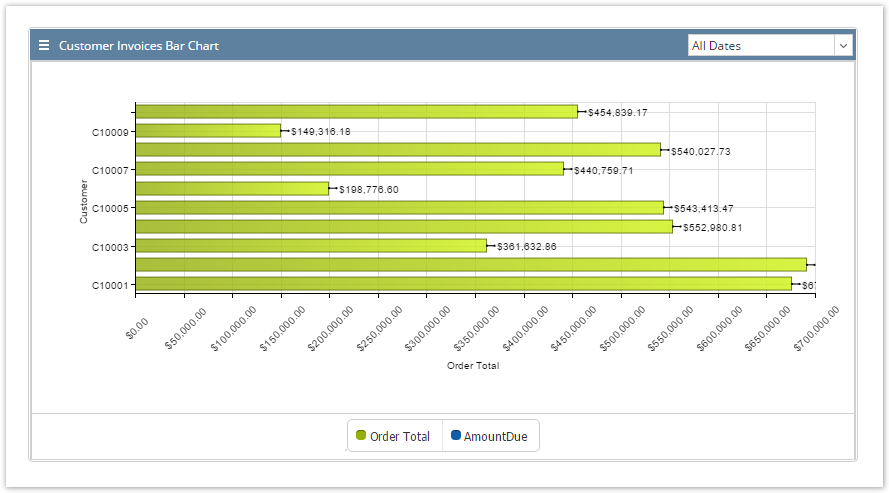
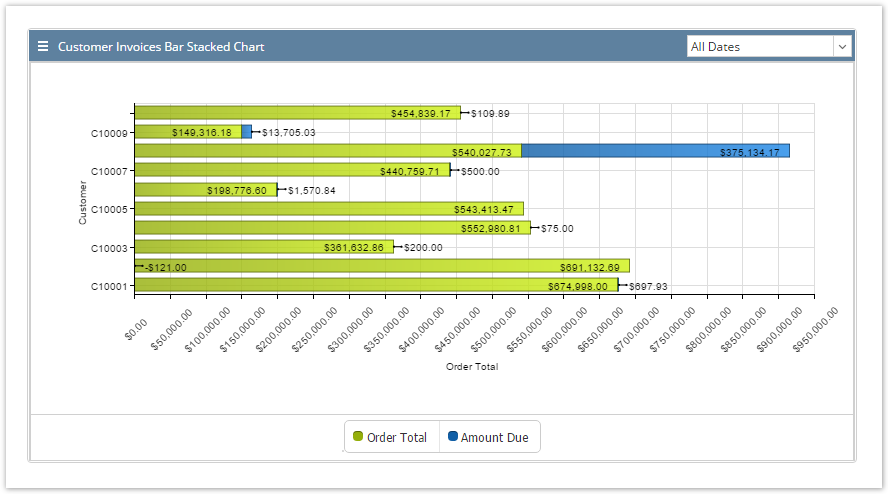
- Sample Result:

- Bar Stacked Chart:
- Sample Result:
Difference on Bar and Bar Stacked can be traced on chart panel using 2 series. Please see below for an example:
Bar Chart 2 Series Setup:
Sample Result:
Bar Stacked Chart 2 Series Setup:
Sample Result:
Overview
Content Tools