Page History
A Column Chart , also known as a bar chart, is a chart with rectangular bars of lengths usually proportional to the magnitudes or frequencies of what they represent. The bars can be horizontally or vertically oriented.
Configuration Option:
| Name | Type | Default | Description | |
|---|---|---|---|---|
| Legend | boolean | false | Title of the axis | |
| Height | number | 250 | The height of the chart in pixels | |
| Color | boolean/number | base | Graph coloring | |
| Label Position | number | 0 | Labeling graphs | |
| Axis X: Column Name | string | The Column Name of where we get the data. | ||
| Axis X: Title/Legend | string | Title to be set on the chart | ||
| Axis X: Display Title | boolean | false | ||
| Axis X: Format | string | number | ||
| Axis Y: Column Name | string | The Column Name of where we get the data. | ||
| Axis Y: Title/Legend | string | Title to be set on the chart | ||
| Axis Y: Display Title | boolean | false | ||
| Axis Y: Format | string | number |
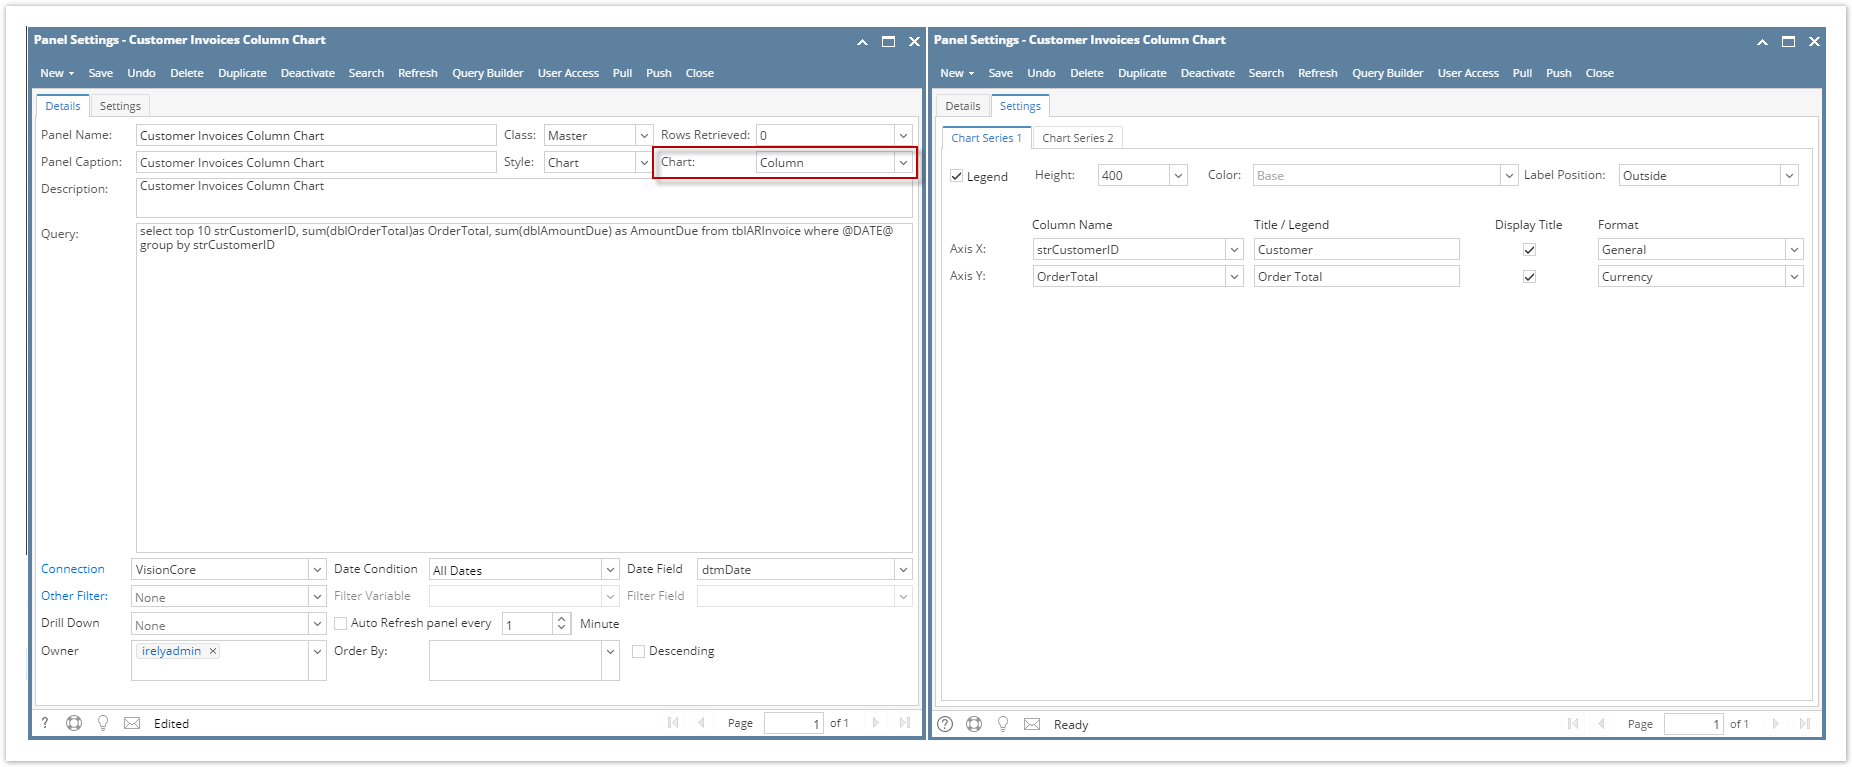
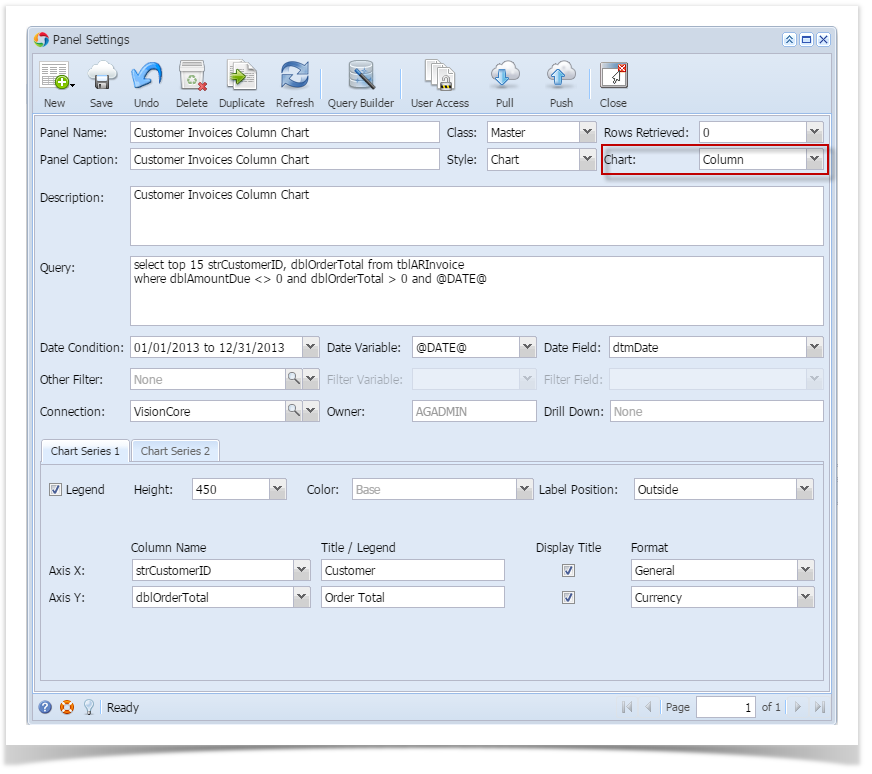
Sample Panel Settings:
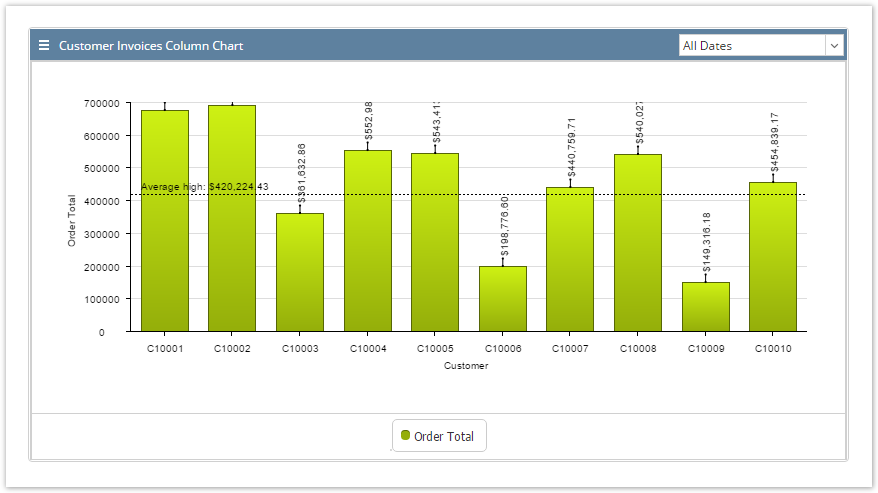
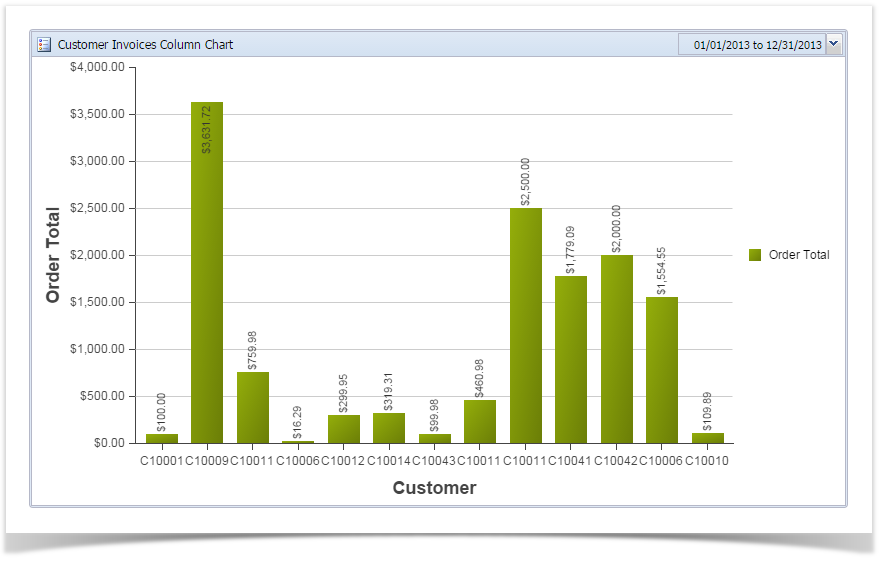
- Column Chart:
- Sample Result:
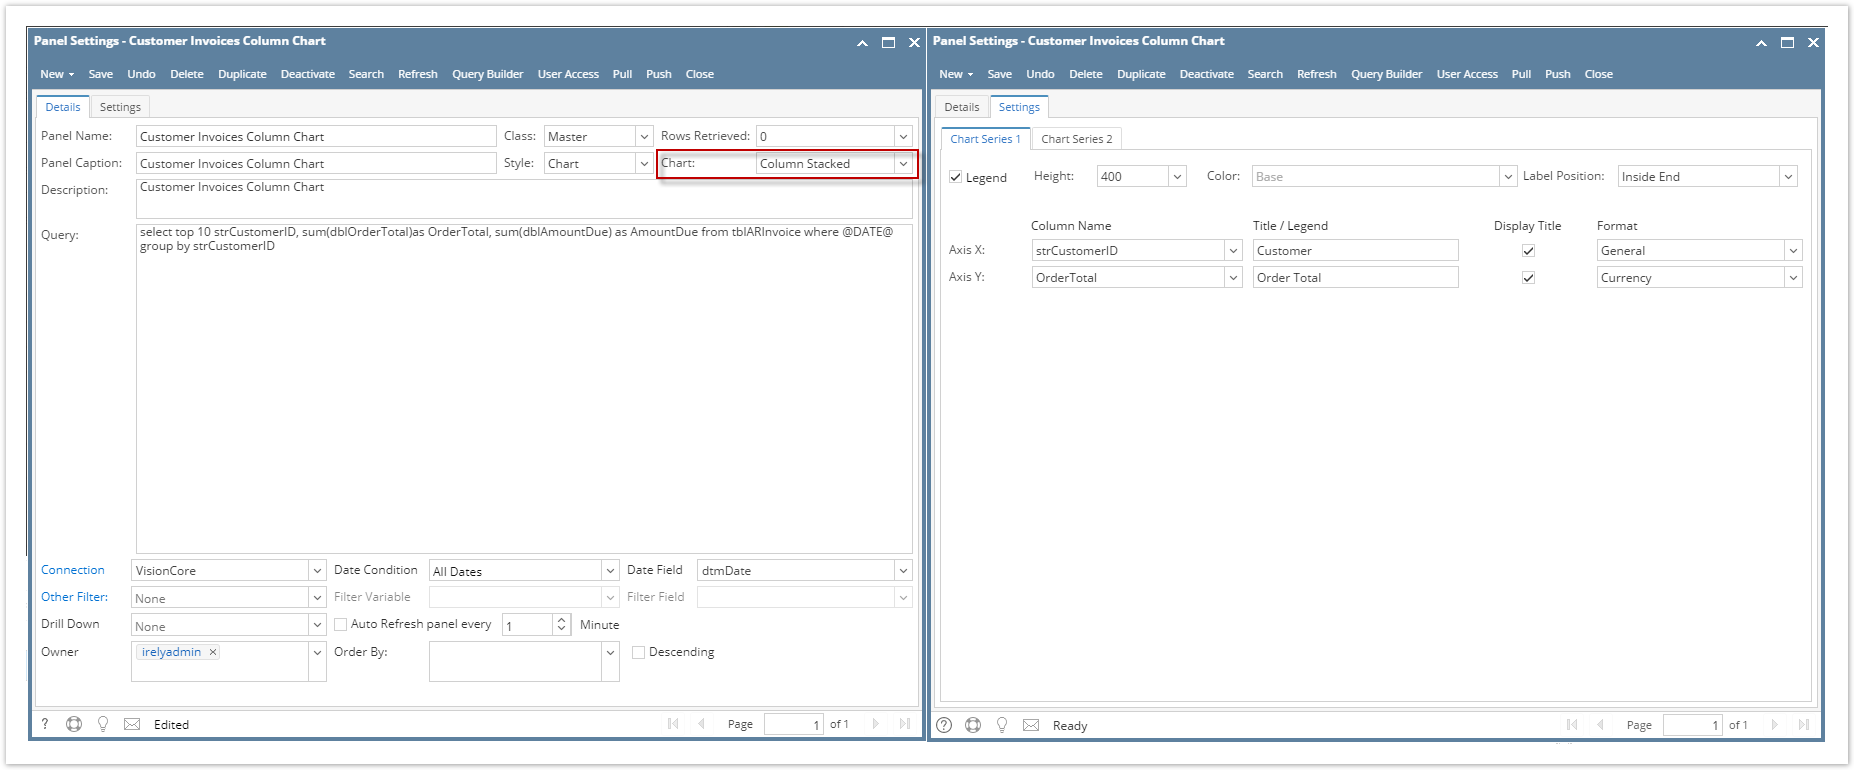
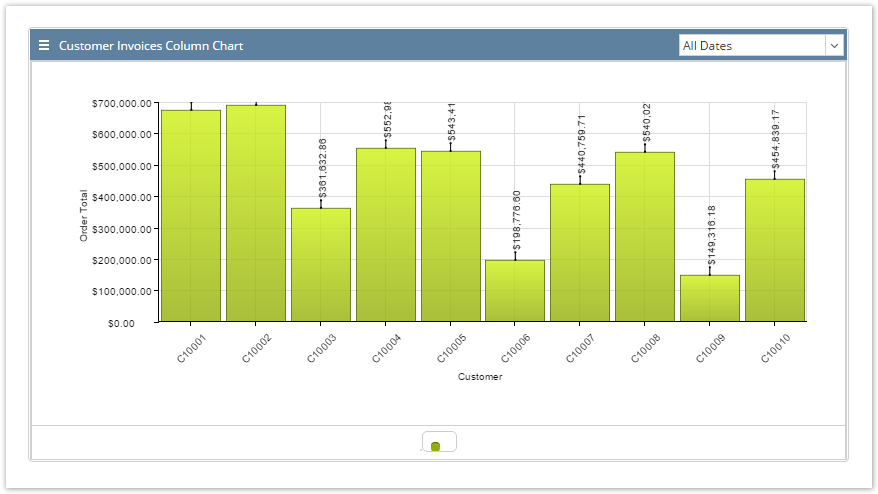
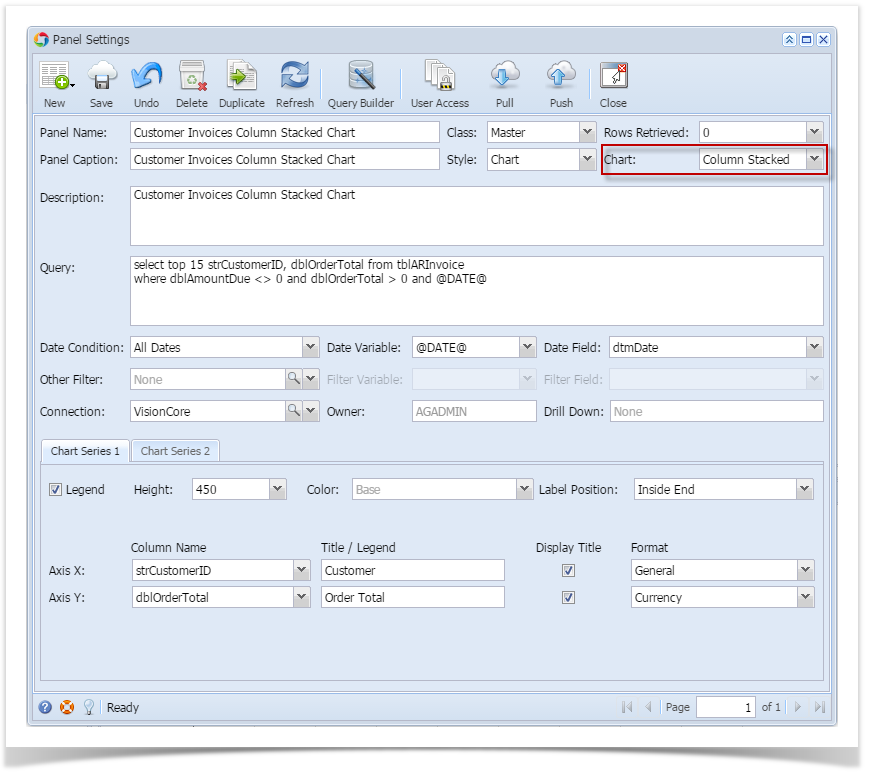
- Column Stacked Chart:
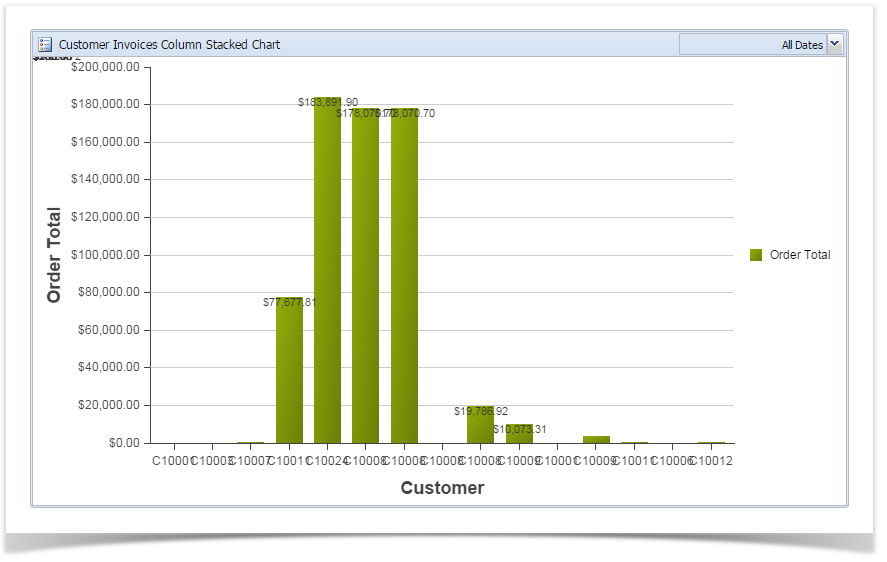
- Sample Result:
...
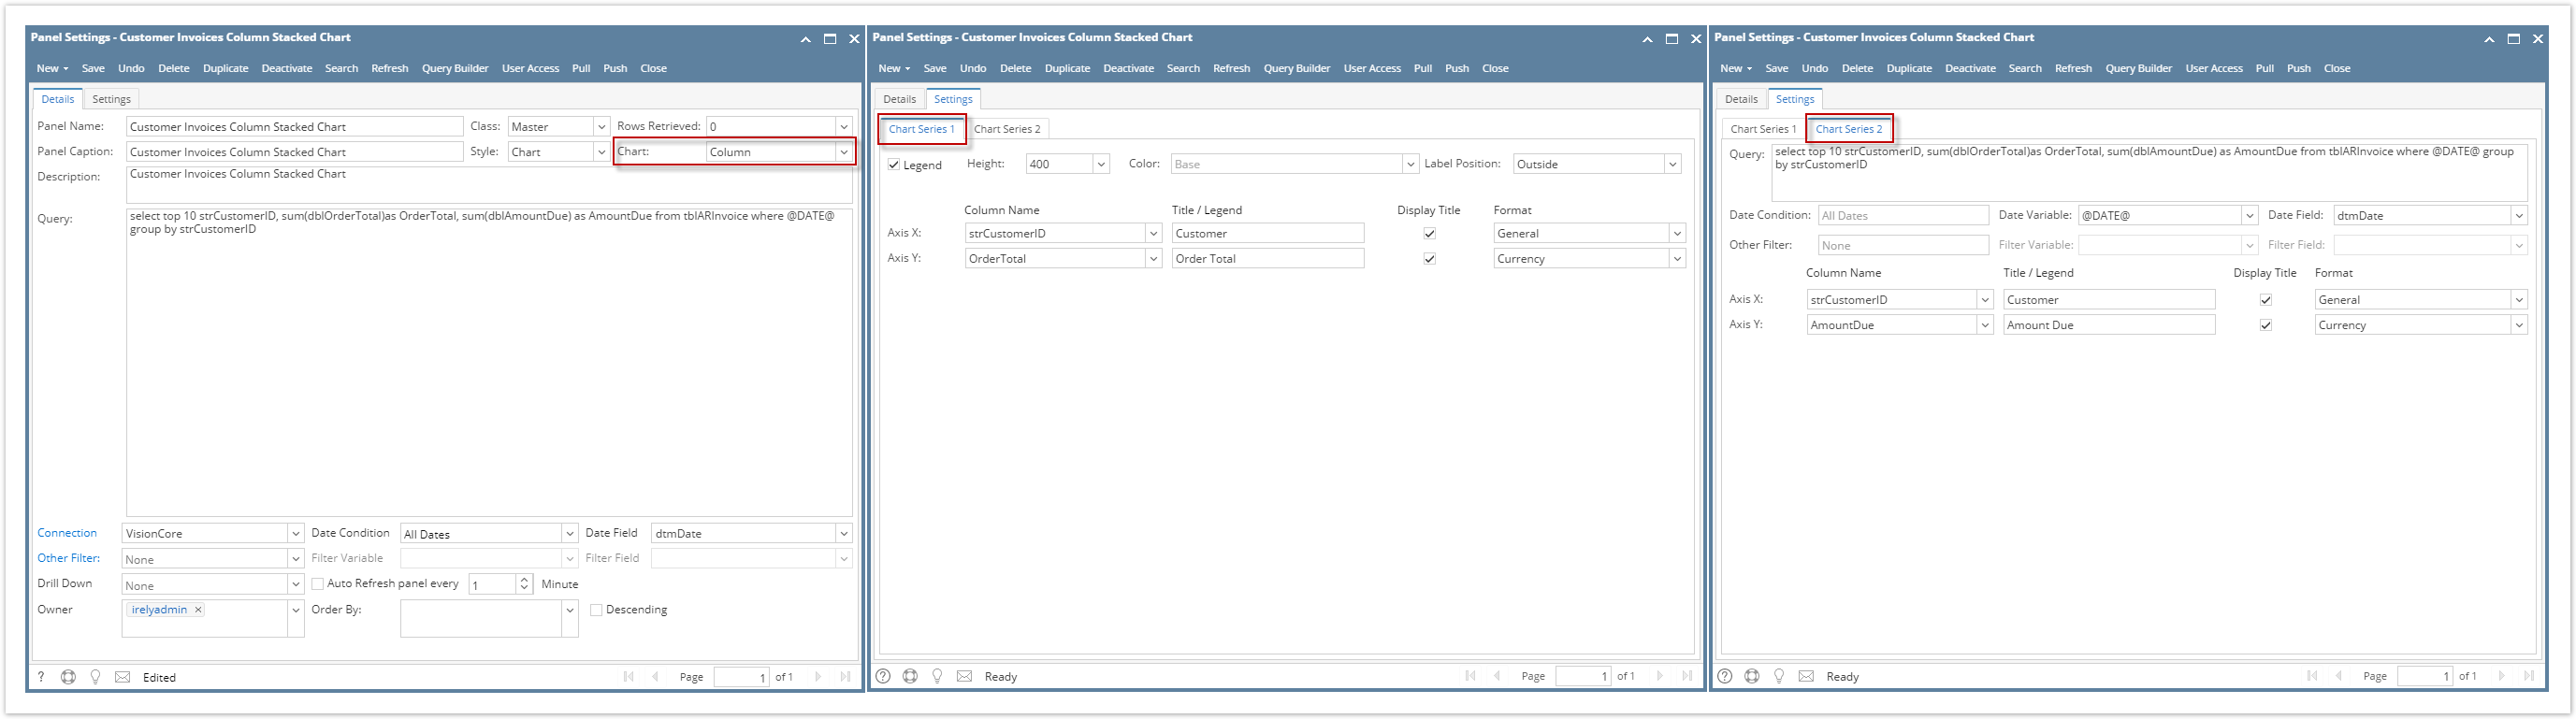
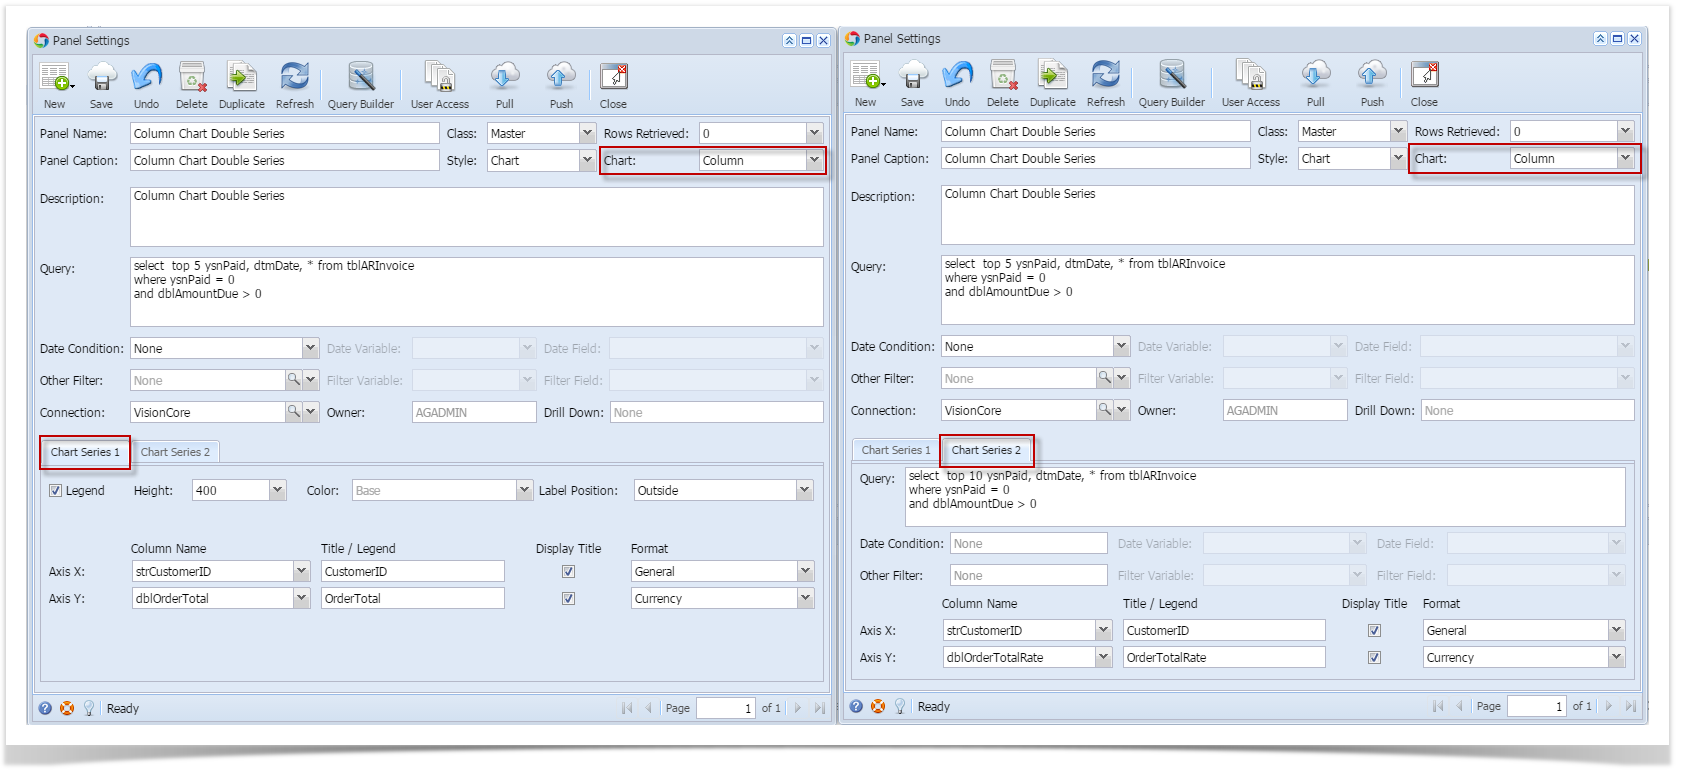
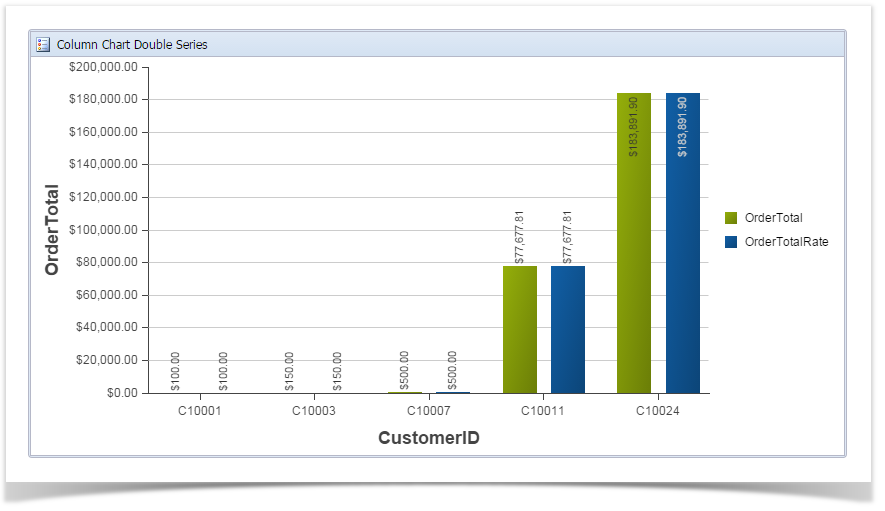
Difference on Bar and Bar Stacked can be traced on chart panel using 2 series. Please see below for an example:
Column Chart 2 Series Setup:
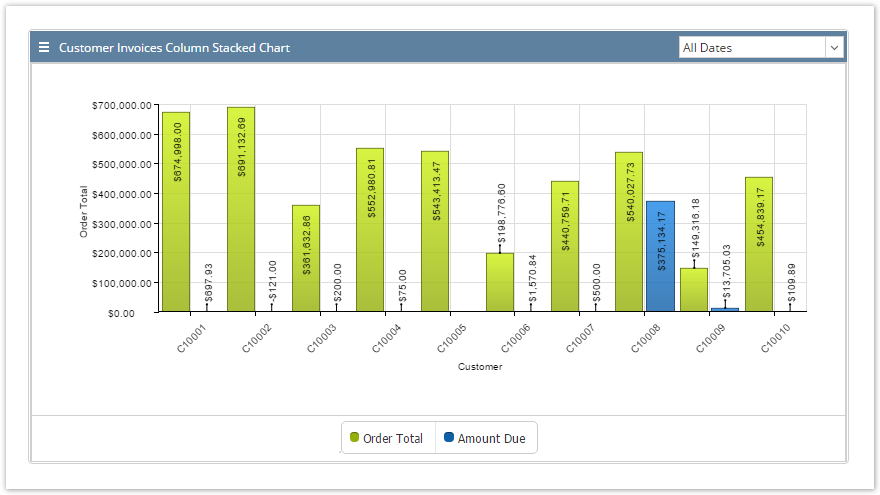
Sample Result:
Column Stacked Chart 2 Series Setup:

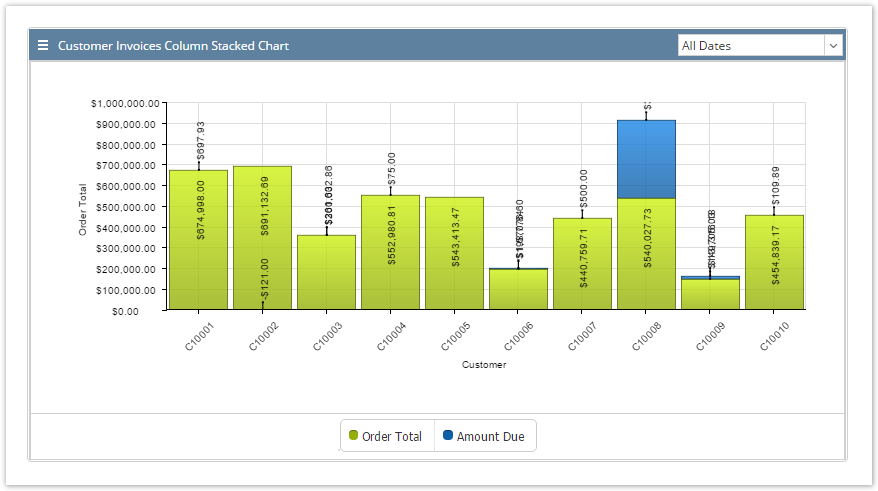
Sample Result:
...
| title | 15.3 |
|---|
A Column Chart , also known as a bar chart, is a chart with rectangular bars of lengths usually proportional to the magnitudes or frequencies of what they represent. The bars can be horizontally or vertically oriented.
Configuration Option:
| Name | Type | Default | Description |
|---|---|---|---|
| Legend | boolean | false | Title of the axis |
| Height | number | 250 | The height of the chart in pixels |
| Color | boolean/number | base | Graph coloring |
| Label Position | number | 0 | Labeling graphs |
| Axis X: Column Name | string | The Column Name of where we get the data. | |
| Axis X: Title/Legend | string | Title to be set on the chart | |
| Axis X: Display Title | boolean | false | |
| Axis X: Format | string | number | |
| Axis Y: Column Name | string | The Column Name of where we get the data. | |
| Axis Y: Title/Legend | string | Title to be set on the chart | |
| Axis Y: Display Title | boolean | false | |
| Axis Y: Format | string | number |
Sample Panel Settings:
- Column Chart:
- Sample Result:
- Column Stacked Chart:
- Sample Result:
Difference on Bar and Bar Stacked can be traced on chart panel using 2 series. Please see below for an example:
Column Chart 2 Series Setup:
Sample Result:
Column Stacked Chart 2 Series Setup:

Sample Result:
...
Overview
Content Tools