Ticket Summary
- On the Menu Panel, click on Help Desk.
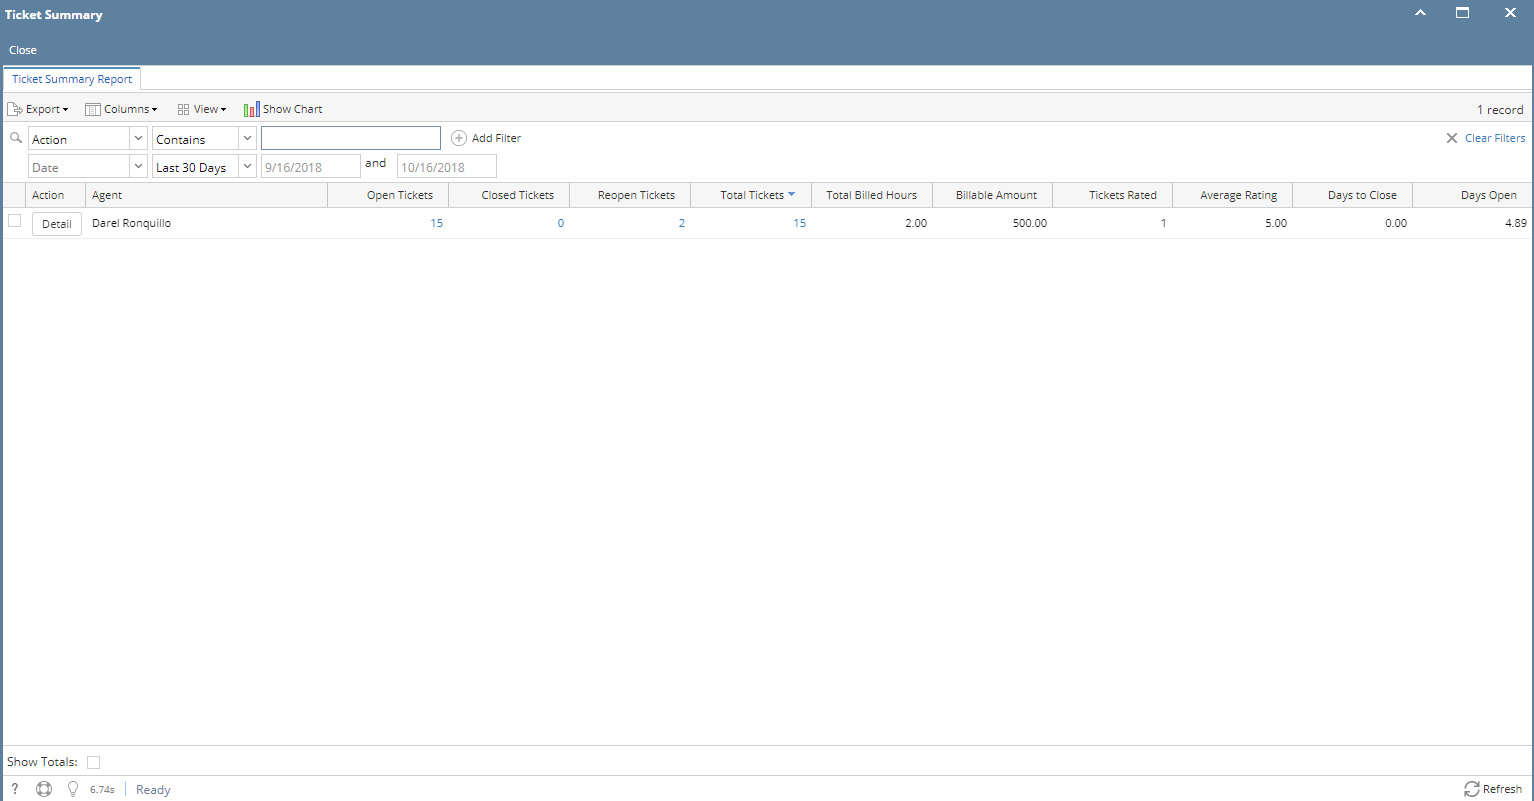
- Click on Ticket Summary under Reports menu.
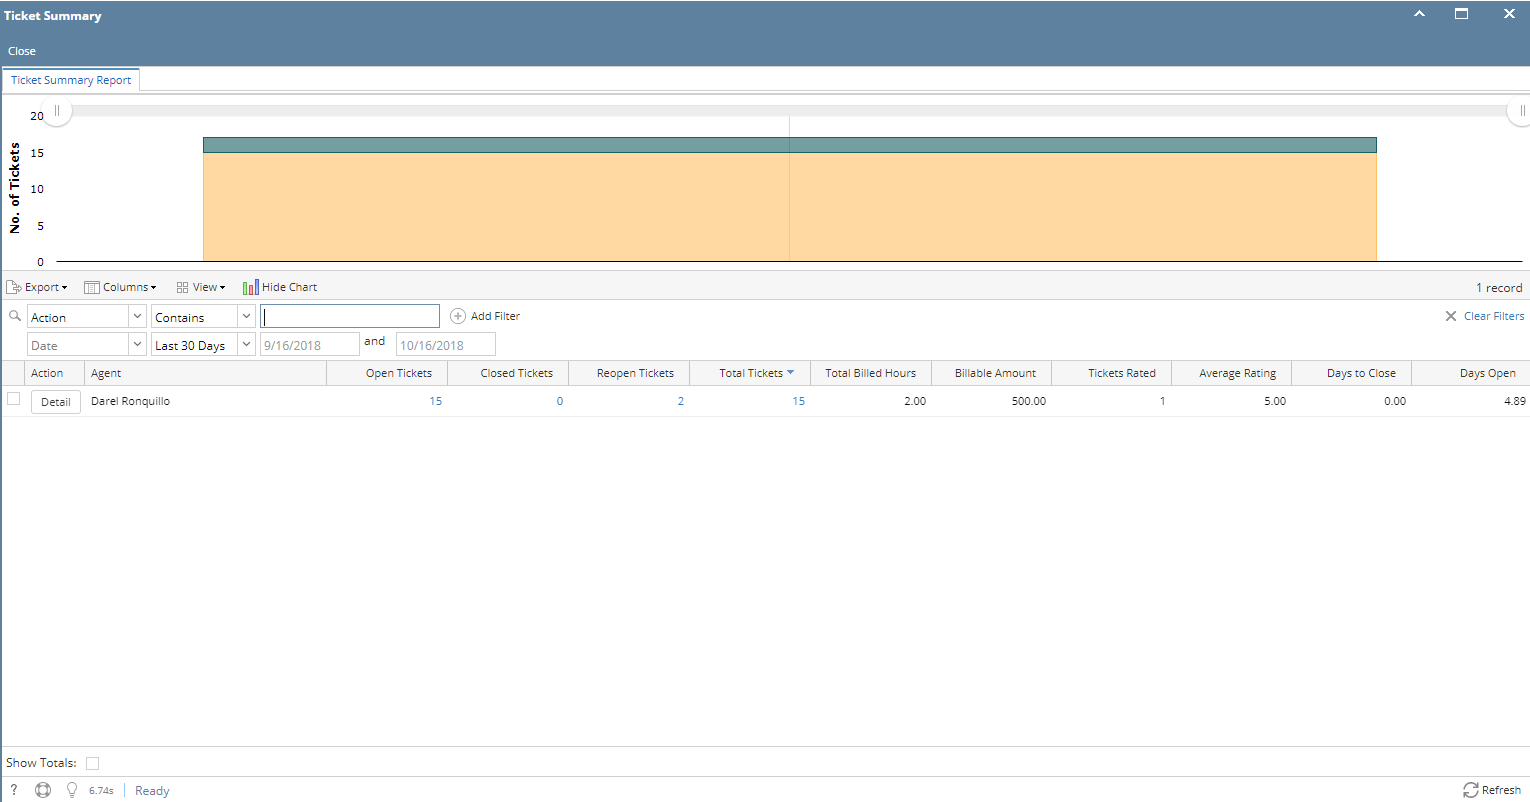
- To display chart, click Show Chart. Show Chart button will change into Hide Chart button.
- To display chart, click Show Chart. Show Chart button will change into Hide Chart button.
- Initial filter should be by Date (Last 30 days) and Action
- To adjust filter, input agent and dates.
- Once filtered, graph should reflect the filtered agents.
- Click Detail grid row button to display ticket details assigned to the agent
- Default filters should be the agent and date from Ticket Summary screen
- Tickets should be grouped by Agent, Ticket Type, Priority
- Columns: Agent, Type, Priority. Open Tickets, Closed Tickets, Reopen Tickets, Total Tickets, Total Billed Hours, Billed Amount
- Click the hyperlink under Open Tickets, Closed Tickets, Reopen Tickets and Total Tickets will open their corresponding Ticket screen containing the tickets filtered using the Agent, Date, Type, Priority and Status.
- From the Ticket Summary grid, user can click the hyperlink under Open Tickets, Closed Tickets, Reopen Tickets and Total Tickets. Ticket screen will appear filtered by the Agent and ticket status.
Overview
Content Tools


